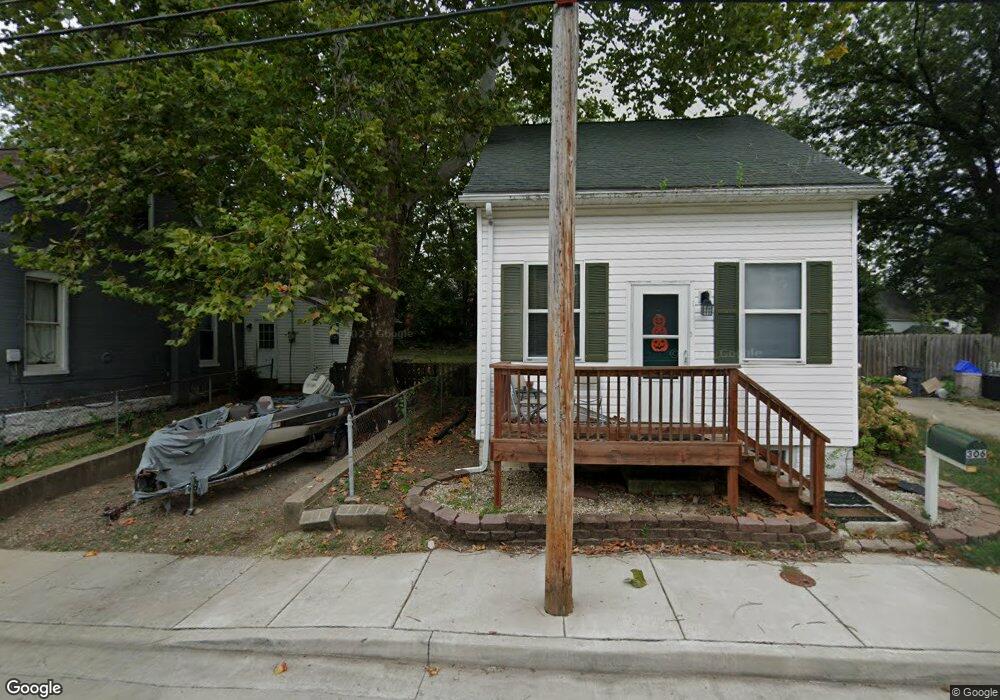
306 N 8th St Belleville, IL 62220
Estimated Value: $54,000 - $103,837
2
Beds
1
Bath
900
Sq Ft
$85/Sq Ft
Est. Value
About This Home
This home is located at 306 N 8th St, Belleville, IL 62220 and is currently estimated at $76,459, approximately $84 per square foot. 306 N 8th St is a home located in St. Clair County with nearby schools including Franklin Elementary School, Central Jr High School, and Governor French Academy.
Ownership History
Date
Name
Owned For
Owner Type
Purchase Details
Closed on
Sep 15, 2024
Sold by
Brown Jeffrey A
Bought by
Brown Dianna and Huff Joseph P
Current Estimated Value
Purchase Details
Closed on
Mar 11, 2016
Sold by
Brown Jeffrey A and Brown Dianna
Bought by
Brown Jeffrey A and Brown Dianna
Purchase Details
Closed on
Mar 3, 2006
Sold by
Foxx Kimberly L
Bought by
Brown Jeffrey A
Home Financials for this Owner
Home Financials are based on the most recent Mortgage that was taken out on this home.
Original Mortgage
$51,500
Interest Rate
6.22%
Mortgage Type
Fannie Mae Freddie Mac
Purchase Details
Closed on
Dec 19, 2001
Sold by
Woolford Kenneth Ray and Pugh Kimberly L
Bought by
Pugh Kimberly L
Home Financials for this Owner
Home Financials are based on the most recent Mortgage that was taken out on this home.
Original Mortgage
$40,500
Interest Rate
7.07%
Mortgage Type
Purchase Money Mortgage
Create a Home Valuation Report for This Property
The Home Valuation Report is an in-depth analysis detailing your home's value as well as a comparison with similar homes in the area
Home Values in the Area
Average Home Value in this Area
Purchase History
| Date | Buyer | Sale Price | Title Company |
|---|---|---|---|
| Brown Dianna | -- | None Available | |
| Brown Jeffrey A | -- | None Available | |
| Brown Jeffrey A | $52,000 | Fatic | |
| Pugh Kimberly L | -- | -- |
Source: Public Records
Mortgage History
| Date | Status | Borrower | Loan Amount |
|---|---|---|---|
| Previous Owner | Brown Jeffrey A | $51,500 | |
| Previous Owner | Pugh Kimberly L | $40,500 |
Source: Public Records
Tax History Compared to Growth
Tax History
| Year | Tax Paid | Tax Assessment Tax Assessment Total Assessment is a certain percentage of the fair market value that is determined by local assessors to be the total taxable value of land and additions on the property. | Land | Improvement |
|---|---|---|---|---|
| 2024 | $1,717 | $25,523 | $2,300 | $23,223 |
| 2023 | $2,139 | $22,788 | $2,254 | $20,534 |
| 2022 | $1,389 | $20,515 | $2,029 | $18,486 |
| 2021 | $1,293 | $18,966 | $1,876 | $17,090 |
| 2020 | $1,231 | $17,936 | $1,774 | $16,162 |
| 2019 | $1,152 | $17,121 | $1,777 | $15,344 |
| 2018 | $1,734 | $16,751 | $1,739 | $15,012 |
| 2017 | $1,721 | $16,632 | $1,726 | $14,906 |
| 2016 | $1,699 | $16,278 | $1,689 | $14,589 |
| 2014 | $1,874 | $20,264 | $1,543 | $18,721 |
| 2013 | $1,854 | $20,554 | $1,565 | $18,989 |
Source: Public Records
Map
Nearby Homes