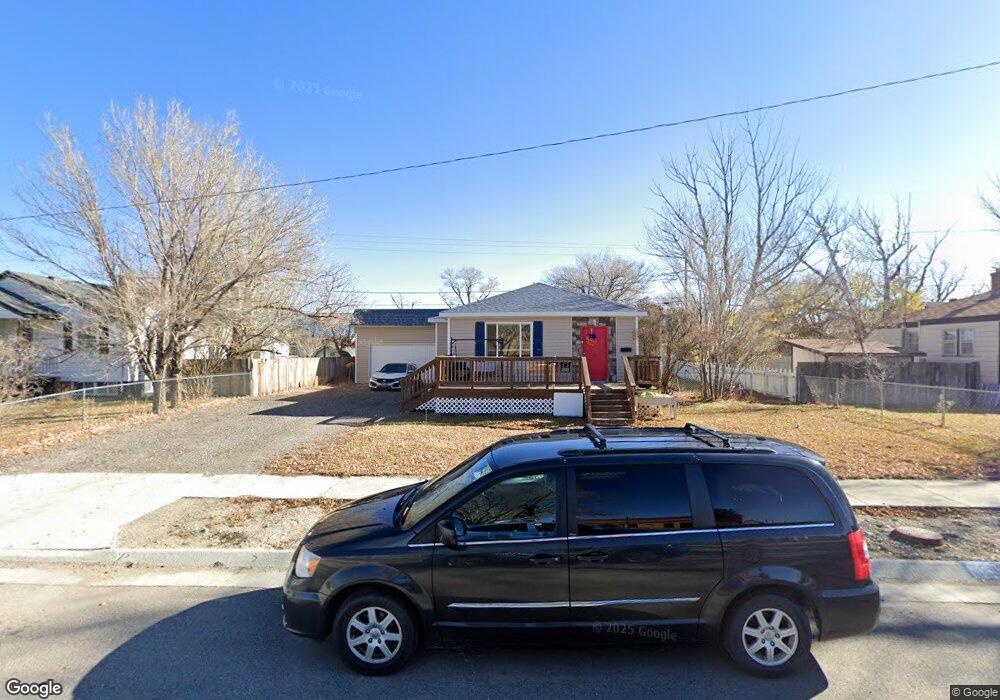
306 N 9th St Sinclair, WY 82334
Estimated Value: $190,000 - $216,000
4
Beds
2
Baths
2,502
Sq Ft
$81/Sq Ft
Est. Value
About This Home
This home is located at 306 N 9th St, Sinclair, WY 82334 and is currently estimated at $201,955, approximately $80 per square foot. 306 N 9th St is a home located in Carbon County with nearby schools including Rawlins Middle School and Rawlins High School.
Ownership History
Date
Name
Owned For
Owner Type
Purchase Details
Closed on
Jun 27, 2012
Sold by
The Secretary Of Housing & Urban Develop
Bought by
Taylor Brandon D and Taylor Callie May
Current Estimated Value
Home Financials for this Owner
Home Financials are based on the most recent Mortgage that was taken out on this home.
Original Mortgage
$139,529
Outstanding Balance
$96,906
Interest Rate
3.8%
Mortgage Type
FHA
Estimated Equity
$105,049
Purchase Details
Closed on
Mar 19, 2012
Sold by
Wadsworth Jason and Wadsworth Brenna
Bought by
The Secretary Of Housing & Urban Develop
Purchase Details
Closed on
Sep 13, 2007
Sold by
Hughes Truman
Bought by
Wadsworth Jason and Wadsworth Brenna
Create a Home Valuation Report for This Property
The Home Valuation Report is an in-depth analysis detailing your home's value as well as a comparison with similar homes in the area
Purchase History
| Date | Buyer | Sale Price | Title Company |
|---|---|---|---|
| Taylor Brandon D | -- | None Available | |
| The Secretary Of Housing & Urban Develop | $159,134 | None Available | |
| Wadsworth Jason | -- | None Available |
Source: Public Records
Mortgage History
| Date | Status | Borrower | Loan Amount |
|---|---|---|---|
| Open | Taylor Brandon D | $139,529 |
Source: Public Records
Tax History
| Year | Tax Paid | Tax Assessment Tax Assessment Total Assessment is a certain percentage of the fair market value that is determined by local assessors to be the total taxable value of land and additions on the property. | Land | Improvement |
|---|---|---|---|---|
| 2025 | $1,642 | $16,188 | $1,525 | $14,663 |
| 2024 | $16 | $22,736 | $1,955 | $20,781 |
| 2023 | $1,632 | $22,602 | $1,955 | $20,647 |
| 2022 | $1,483 | $20,255 | $1,590 | $18,665 |
| 2021 | $1,483 | $19,617 | $1,590 | $18,027 |
| 2020 | $1,373 | $37,982 | $3,180 | $34,802 |
| 2019 | $1,353 | $18,819 | $1,590 | $17,229 |
| 2018 | $1,246 | $17,051 | $1,590 | $15,461 |
| 2017 | $1,225 | $16,849 | $1,590 | $15,259 |
| 2016 | $1,203 | $16,543 | $1,590 | $14,953 |
| 2015 | -- | $12,770 | $1,590 | $11,180 |
| 2014 | -- | $12,535 | $1,590 | $10,945 |
Source: Public Records
Map
Nearby Homes
- 801 Madison Ave
- Tbd
- 460 Airport Rd
- 609 Olive Cir
- 821 Ash St
- 805 Apple Ave
- 1815 Edinburgh St
- 2514 Kilmary Dr
- 475 County Road 324
- 3008 Shetland Dr
- Tract 1 Blk 2 Monroe St
- Tract 3 Blk 1 Monroe St
- PT NW 1/4 Sec Monroe St
- 309 E Center St
- 305 E Center St
- 500 Madison St
- 205 E State St
- 901 Daley St
- 0 Interstate 80
- 1224 Delta St
Your Personal Tour Guide
Ask me questions while you tour the home.