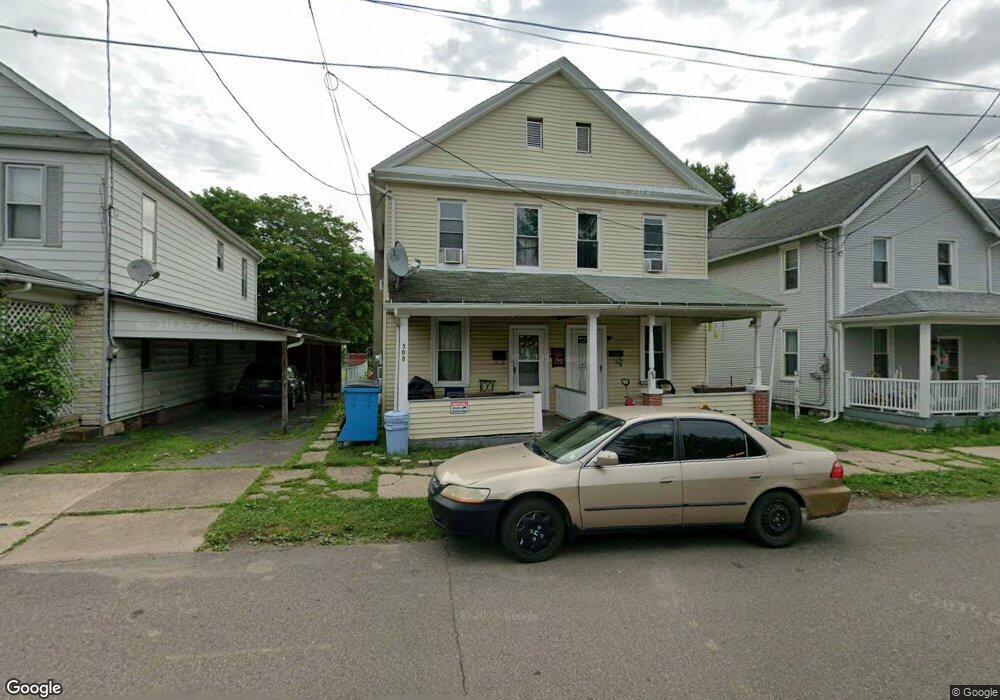
306 N Arch St Berwick, PA 18603
Estimated Value: $112,000 - $139,439
--
Bed
--
Bath
2,240
Sq Ft
$54/Sq Ft
Est. Value
About This Home
This home is located at 306 N Arch St, Berwick, PA 18603 and is currently estimated at $120,610, approximately $53 per square foot. 306 N Arch St is a home located in Columbia County with nearby schools including Berwick Area High School, Holy Family Consolidated School, and New Story School.
Ownership History
Date
Name
Owned For
Owner Type
Purchase Details
Closed on
Dec 10, 2021
Sold by
Disabella Laura Marie
Bought by
Shaffer Austin D
Current Estimated Value
Home Financials for this Owner
Home Financials are based on the most recent Mortgage that was taken out on this home.
Original Mortgage
$19,396
Outstanding Balance
$17,834
Interest Rate
3.09%
Mortgage Type
FHA
Estimated Equity
$102,776
Purchase Details
Closed on
May 4, 2016
Sold by
Davis James M
Bought by
Disabella Laura Marie
Home Financials for this Owner
Home Financials are based on the most recent Mortgage that was taken out on this home.
Original Mortgage
$24,000
Interest Rate
3.71%
Mortgage Type
New Conventional
Purchase Details
Closed on
Oct 16, 2014
Sold by
Jaffin Mark and Jaffin Judy
Bought by
Davis James D
Purchase Details
Closed on
Oct 15, 1987
Bought by
Jaffin Mark and Jaffin Judy
Create a Home Valuation Report for This Property
The Home Valuation Report is an in-depth analysis detailing your home's value as well as a comparison with similar homes in the area
Home Values in the Area
Average Home Value in this Area
Purchase History
| Date | Buyer | Sale Price | Title Company |
|---|---|---|---|
| Shaffer Austin D | $90,000 | Multi County Land Abstract | |
| Disabella Laura Marie | $30,000 | Attorney | |
| Davis James D | $4,000 | None Available | |
| Jaffin Mark | $10,000 | -- |
Source: Public Records
Mortgage History
| Date | Status | Borrower | Loan Amount |
|---|---|---|---|
| Open | Shaffer Austin D | $19,396 | |
| Previous Owner | Disabella Laura Marie | $24,000 |
Source: Public Records
Tax History Compared to Growth
Tax History
| Year | Tax Paid | Tax Assessment Tax Assessment Total Assessment is a certain percentage of the fair market value that is determined by local assessors to be the total taxable value of land and additions on the property. | Land | Improvement |
|---|---|---|---|---|
| 2025 | $971 | $10,833 | $0 | $0 |
| 2024 | $960 | $10,833 | $2,500 | $8,333 |
| 2023 | $895 | $10,833 | $2,500 | $8,333 |
| 2022 | $866 | $10,833 | $2,500 | $8,333 |
| 2021 | $847 | $10,833 | $2,500 | $8,333 |
| 2020 | $827 | $10,833 | $2,500 | $8,333 |
| 2019 | $814 | $10,833 | $2,500 | $8,333 |
| 2018 | $782 | $10,833 | $2,500 | $8,333 |
| 2017 | $785 | $10,833 | $2,500 | $8,333 |
| 2016 | -- | $10,833 | $2,500 | $8,333 |
| 2015 | -- | $10,833 | $2,500 | $8,333 |
| 2014 | -- | $10,833 | $2,500 | $8,333 |
Source: Public Records
Map
Nearby Homes
- 1239,1241 W Front St
- 1306 Orange St
- 405 N Mercer St
- 108 110 Blair St
- 1185 Ferris Ave
- 1510 Spring Garden Ave
- 10041006 W Front St
- 1180 1st Ave
- 0 Spring Garden Ave
- 1522 1st Ave
- 200 Iron St
- 205 Hughes St
- 334 Washington St
- LOT #13 3rd Ave
- 1619 Brittain St
- 530 Monroe St
- 1638 Brittain St
- 613 Elm St
- 825 Susquehanna Ave
- 605 Sycamore St
- 308 N Arch St
- 302 N Arch St
- 310312 Arch St
- 220 N Arch St
- 314 N Arch St
- 1225 Dewey St
- 1224 Dewey St
- 1221 Dewey St
- 301 N Arch St
- 1300 Fairview Ave
- 209 N Arch St
- 1220 Dewey St
- 1217 Dewey St
- 1308 Fairview Ave
- 1239 Spring Garden Ave
- 223 N Arch St
- 1221 Spring Garden Ave
- 1224 Orange St
- 1220 Orange St
- 1215 Dewey St