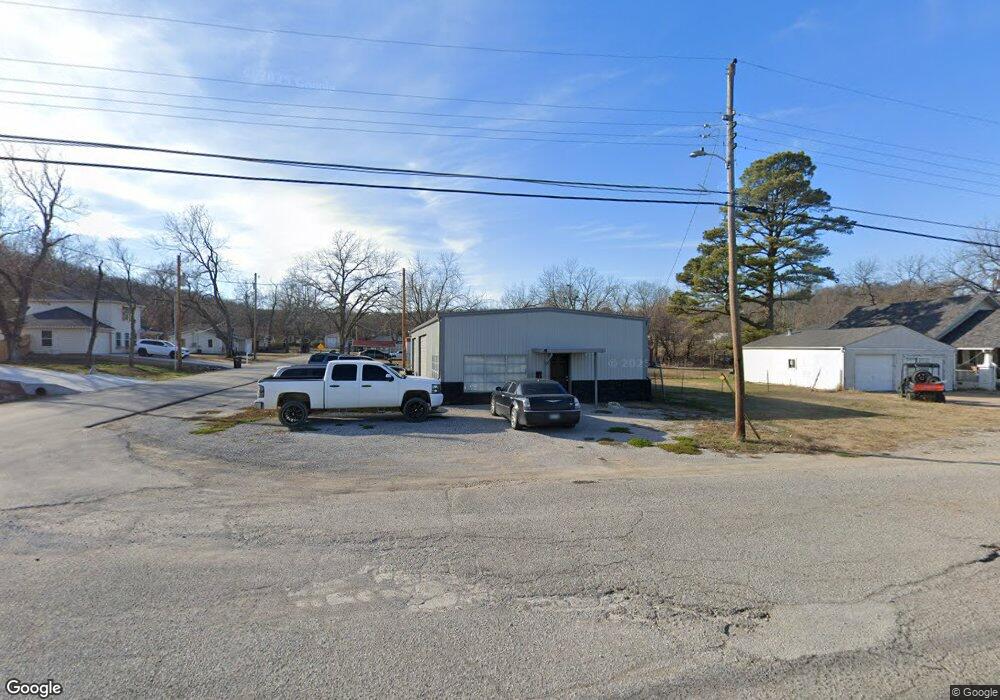
306 N Main Kiefer, OK 74041
Estimated Value: $120,415
Studio
1
Bath
1,800
Sq Ft
$67/Sq Ft
Est. Value
About This Home
This home is located at 306 N Main, Kiefer, OK 74041 and is currently estimated at $120,415, approximately $66 per square foot. 306 N Main is a home located in Creek County with nearby schools including Kiefer Elementary School, Rongey Middle School, and Kiefer High School.
Ownership History
Date
Name
Owned For
Owner Type
Purchase Details
Closed on
May 26, 2023
Sold by
Lester Dallas R
Bought by
C R Enlow Properties Llc
Current Estimated Value
Home Financials for this Owner
Home Financials are based on the most recent Mortgage that was taken out on this home.
Original Mortgage
$80,000
Outstanding Balance
$65,185
Interest Rate
5.71%
Mortgage Type
New Conventional
Estimated Equity
$55,230
Purchase Details
Closed on
Oct 22, 2021
Sold by
Shadowens Marty L and Shadowens Rebecca L
Bought by
Lester Dallas R
Home Financials for this Owner
Home Financials are based on the most recent Mortgage that was taken out on this home.
Original Mortgage
$72,000
Interest Rate
2.8%
Mortgage Type
Seller Take Back
Purchase Details
Closed on
Jun 11, 2018
Sold by
Shadowens Michael and Shadowens Mary
Bought by
Shadowens Brooke and Hara Garrett O
Purchase Details
Closed on
Jul 7, 2014
Sold by
Applied Computer Resources Inc
Bought by
Shadowens Marry and Shadowens Mark
Create a Home Valuation Report for This Property
The Home Valuation Report is an in-depth analysis detailing your home's value as well as a comparison with similar homes in the area
Home Values in the Area
Average Home Value in this Area
Purchase History
| Date | Buyer | Sale Price | Title Company |
|---|---|---|---|
| C R Enlow Properties Llc | $110,000 | None Listed On Document | |
| Lester Dallas R | $80,000 | None Available | |
| Shadowens Brooke | -- | None Available | |
| Shadowens Marry | $45,000 | None Available |
Source: Public Records
Mortgage History
| Date | Status | Borrower | Loan Amount |
|---|---|---|---|
| Open | C R Enlow Properties Llc | $80,000 | |
| Previous Owner | Lester Dallas R | $72,000 |
Source: Public Records
Tax History
| Year | Tax Paid | Tax Assessment Tax Assessment Total Assessment is a certain percentage of the fair market value that is determined by local assessors to be the total taxable value of land and additions on the property. | Land | Improvement |
|---|---|---|---|---|
| 2025 | $1,372 | $13,200 | $5,967 | $7,233 |
| 2024 | $1,372 | $13,200 | $5,967 | $7,233 |
| 2023 | $1,372 | $7,473 | $1,200 | $6,273 |
| 2022 | $714 | $7,117 | $1,200 | $5,917 |
| 2021 | $621 | $5,771 | $1,200 | $4,571 |
| 2020 | $595 | $5,683 | $1,200 | $4,483 |
| 2019 | $580 | $5,623 | $1,178 | $4,445 |
| 2018 | $579 | $5,623 | $1,178 | $4,445 |
| 2017 | $559 | $5,623 | $1,178 | $4,445 |
| 2016 | $563 | $5,623 | $1,178 | $4,445 |
| 2015 | -- | $5,623 | $1,178 | $4,445 |
| 2014 | -- | $4,017 | $1,178 | $2,839 |
Source: Public Records
Map
Nearby Homes
- 115 Stiller Ave
- 13425 S Garrett St
- 311 E Indiana
- 112 Stark St
- 14507 S 49th West Ave
- 13435 S Garrett St
- 8755 Sunset Dr
- 8850 W 151st St S
- 16375 S 61st West Ave
- 15116 S 90th West Ave
- 6355 Rockwood Cir N
- 129 Dp Newman Cir
- 7618 W 131st St S
- 10917 33rd West Ave
- 13623 S 97th Ave W
- 16042 S 97th West Ave
- 0 33rd West Ave
- 14508 S Justin Ave
- 14556 Courtney Ln
- 15375 S 26th West Ave
Your Personal Tour Guide
Ask me questions while you tour the home.