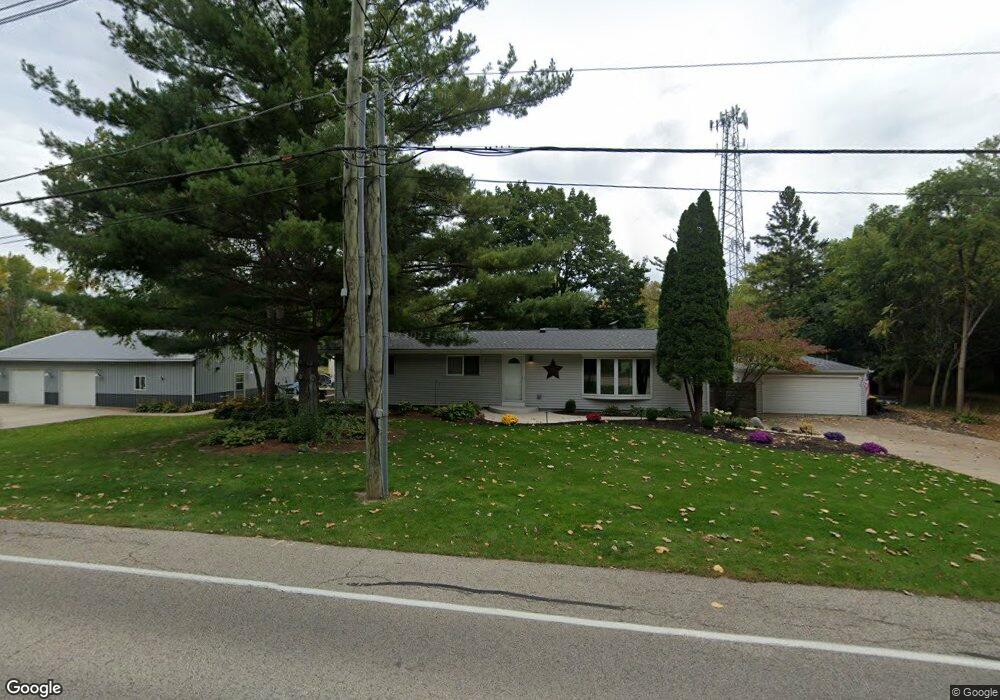
306 Raffel Rd Woodstock, IL 60098
Estimated Value: $270,000 - $299,000
3
Beds
2
Baths
1,235
Sq Ft
$231/Sq Ft
Est. Value
About This Home
This home is located at 306 Raffel Rd, Woodstock, IL 60098 and is currently estimated at $285,739, approximately $231 per square foot. 306 Raffel Rd is a home located in McHenry County with nearby schools including Olson Elementary School, Northwood Middle School, and Woodstock North High School.
Ownership History
Date
Name
Owned For
Owner Type
Purchase Details
Closed on
Dec 28, 2011
Sold by
Hsbc Bank Usa National Association
Bought by
Deserto Brian A and Deserto Meagan
Current Estimated Value
Purchase Details
Closed on
Nov 29, 2011
Sold by
Foster Ellen Margaret and Foster Ellen M
Bought by
Hsbc Bank Usa National Association
Purchase Details
Closed on
Jun 8, 2006
Sold by
Asher Oland and Asher Sharon
Bought by
Foster Ellen Margaret
Home Financials for this Owner
Home Financials are based on the most recent Mortgage that was taken out on this home.
Original Mortgage
$221,600
Interest Rate
6.66%
Mortgage Type
Fannie Mae Freddie Mac
Purchase Details
Closed on
Jul 16, 1998
Sold by
Asher Sharon
Bought by
Asher Oland and Asher Sharon
Purchase Details
Closed on
Jul 7, 1997
Sold by
Prickett Sharon C
Bought by
Prickett Sharon C and Asher Sharon
Purchase Details
Closed on
Jul 31, 1995
Sold by
Prickett Charles L and Spoerline Sharon C
Bought by
Prickett Sharon C
Create a Home Valuation Report for This Property
The Home Valuation Report is an in-depth analysis detailing your home's value as well as a comparison with similar homes in the area
Home Values in the Area
Average Home Value in this Area
Purchase History
| Date | Buyer | Sale Price | Title Company |
|---|---|---|---|
| Deserto Brian A | $89,000 | None Available | |
| Hsbc Bank Usa National Association | -- | None Available | |
| Foster Ellen Margaret | $277,000 | Multiple | |
| Asher Oland | -- | -- | |
| Prickett Sharon C | -- | -- | |
| Prickett Sharon C | -- | -- |
Source: Public Records
Mortgage History
| Date | Status | Borrower | Loan Amount |
|---|---|---|---|
| Previous Owner | Foster Ellen Margaret | $221,600 |
Source: Public Records
Tax History Compared to Growth
Tax History
| Year | Tax Paid | Tax Assessment Tax Assessment Total Assessment is a certain percentage of the fair market value that is determined by local assessors to be the total taxable value of land and additions on the property. | Land | Improvement |
|---|---|---|---|---|
| 2024 | $4,826 | $70,095 | $17,548 | $52,547 |
| 2023 | $4,698 | $64,102 | $16,048 | $48,054 |
| 2022 | $4,567 | $57,599 | $14,420 | $43,179 |
| 2021 | $4,363 | $53,590 | $13,416 | $40,174 |
| 2020 | $4,218 | $50,810 | $12,720 | $38,090 |
| 2019 | $4,028 | $47,839 | $11,976 | $35,863 |
| 2018 | $3,774 | $44,882 | $11,236 | $33,646 |
| 2017 | $3,687 | $42,123 | $10,545 | $31,578 |
| 2016 | $3,683 | $39,395 | $9,900 | $29,495 |
| 2013 | -- | $27,074 | $9,808 | $17,266 |
Source: Public Records
Map
Nearby Homes
- 214 Raffel Rd
- 1401 Rhett Place
- 109 Raffel Rd
- 1721 Yasgur Dr
- 1530 Hickory Rd Unit A
- 1819 Woodside Dr
- 1832 Yasgur Dr
- 871 Hickman Ln
- 709 Mchenry Ave
- Newport - Two-story Plan at Fairview Estates
- Madison - Two-story Plan at Fairview Estates
- Jefferson - Two-story Plan at Fairview Estates
- Monroe II - Two-story Plan at Fairview Estates
- Truman III - Two-story Plan at Fairview Estates
- Bradshaw - Two-story Plan at Fairview Estates
- Dawson - Two-story Plan at Fairview Estates
- Elway - Ranch Plan at Fairview Estates
- Pasadena II - Ranch Plan at Fairview Estates
- Harrison - Ranch Plan at Fairview Estates
- Adams III - Ranch Plan at Fairview Estates
- 307 Raffel Rd
- 314 Raffel Rd
- 303 Raffel Rd
- 217 Raffel Rd
- 401 Raffel Rd
- 404 Raffel Rd
- 241 Redwing Dr
- 231 Redwing Dr
- 251 Redwing Dr
- 221 Redwing Dr
- 1421 Rhett Place
- 410 Raffel Rd
- 1425 Rhett Place
- 1405 Rhett Place
- 1405 Rhett Place Unit 1
- 1405 Rhett Place Unit 1405
- 1409 Rhett Place
- 1413 Rhett Place
- 409 Raffel Rd
- 1429 Rhett Place