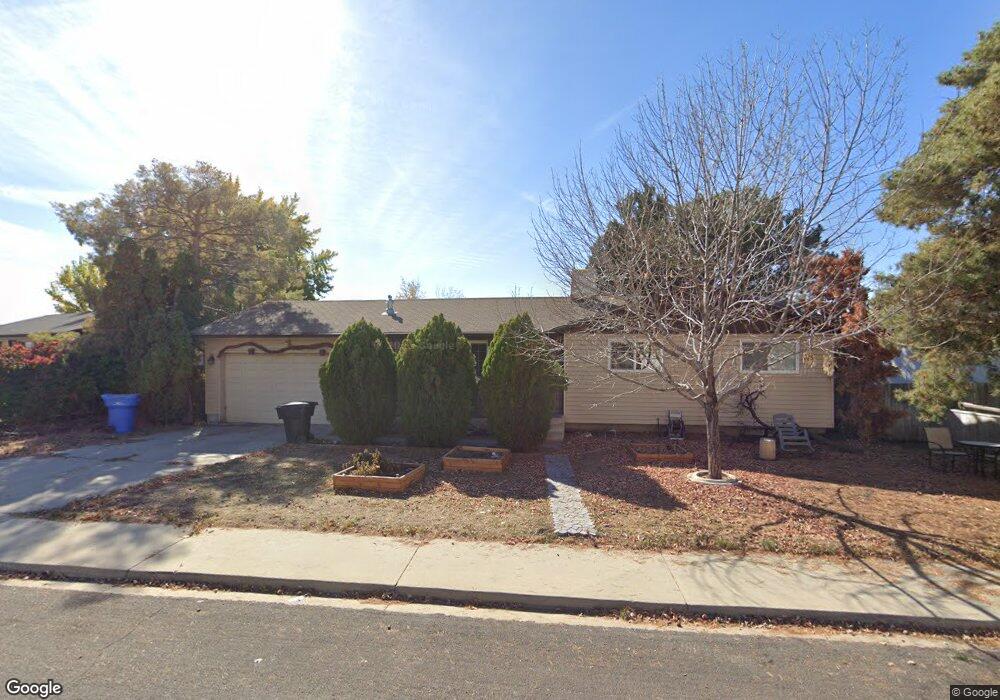
306 S 1160 W Orem, UT 84058
Orem Park NeighborhoodEstimated Value: $504,000 - $557,000
5
Beds
3
Baths
2,240
Sq Ft
$239/Sq Ft
Est. Value
About This Home
This home is located at 306 S 1160 W, Orem, UT 84058 and is currently estimated at $535,698, approximately $239 per square foot. 306 S 1160 W is a home located in Utah County with nearby schools including Orem Elementary School, Orem Junior High School, and Mountain View High School.
Ownership History
Date
Name
Owned For
Owner Type
Purchase Details
Closed on
Aug 30, 2019
Sold by
Gadd Richard S and Darcus Gadd T
Bought by
Lazenby Crystal Ann and Hanley Susan Alana
Current Estimated Value
Home Financials for this Owner
Home Financials are based on the most recent Mortgage that was taken out on this home.
Original Mortgage
$328,932
Outstanding Balance
$289,695
Interest Rate
3.87%
Mortgage Type
FHA
Estimated Equity
$246,003
Purchase Details
Closed on
Aug 19, 2009
Sold by
Gadd Richard S and Darcus Gadd T
Bought by
Gadd Richard S and Darcus Gadd T
Create a Home Valuation Report for This Property
The Home Valuation Report is an in-depth analysis detailing your home's value as well as a comparison with similar homes in the area
Home Values in the Area
Average Home Value in this Area
Purchase History
| Date | Buyer | Sale Price | Title Company |
|---|---|---|---|
| Lazenby Crystal Ann | -- | Meridian Title Company | |
| Gadd Richard S | -- | None Available |
Source: Public Records
Mortgage History
| Date | Status | Borrower | Loan Amount |
|---|---|---|---|
| Open | Lazenby Crystal Ann | $328,932 |
Source: Public Records
Tax History Compared to Growth
Tax History
| Year | Tax Paid | Tax Assessment Tax Assessment Total Assessment is a certain percentage of the fair market value that is determined by local assessors to be the total taxable value of land and additions on the property. | Land | Improvement |
|---|---|---|---|---|
| 2025 | $2,053 | $269,280 | $216,500 | $273,100 |
| 2024 | $2,053 | $251,075 | $0 | $0 |
| 2023 | $1,906 | $250,470 | $0 | $0 |
| 2022 | $1,950 | $248,270 | $0 | $0 |
| 2021 | $1,815 | $350,000 | $169,100 | $180,900 |
| 2020 | $1,650 | $312,700 | $135,300 | $177,400 |
| 2019 | $1,446 | $285,000 | $124,900 | $160,100 |
| 2018 | $1,355 | $255,100 | $107,600 | $147,500 |
| 2017 | $1,204 | $121,440 | $0 | $0 |
| 2016 | $1,240 | $115,335 | $0 | $0 |
| 2015 | $1,203 | $105,820 | $0 | $0 |
| 2014 | $1,118 | $97,900 | $0 | $0 |
Source: Public Records
Map
Nearby Homes
- 1194 W 400 S
- 350 S 1200 W Unit 2
- 155 S 1200 W Unit 6
- 155 S 1200 W Unit 136
- 155 S 1200 W Unit 97
- 155 S 1200 W Unit 91
- 272 S Ridgecrest Dr
- 988 W 170 S
- 849 W 225 S
- 560 S 880 West St Unit 1
- 572 S 880 W
- 896 W 30 S
- 506 S 800 West St Unit 13
- 1069 W 680 S
- 520 S 800 W Unit 14
- 570 S 800 West St Unit 15
- 1509 W 550 S
- 614 S 1470 W
- 1225 W 160 N
- 740 W 580 S