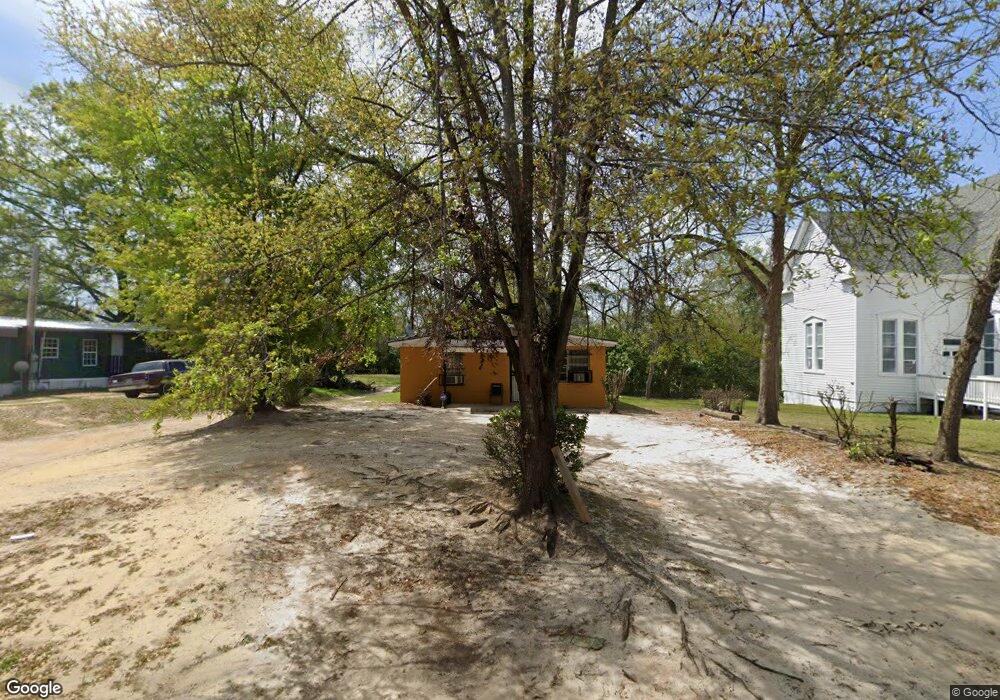
306 S 12th St Cordele, GA 31015
Estimated Value: $30,000 - $46,000
2
Beds
1
Bath
754
Sq Ft
$52/Sq Ft
Est. Value
About This Home
This home is located at 306 S 12th St, Cordele, GA 31015 and is currently estimated at $39,015, approximately $51 per square foot. 306 S 12th St is a home located in Crisp County with nearby schools including Crisp County Elementary School, Crisp County Primary School, and Crisp County Middle School.
Ownership History
Date
Name
Owned For
Owner Type
Purchase Details
Closed on
Apr 30, 2008
Sold by
Mumphery Sammy
Bought by
Mt Zion First African Baptist
Current Estimated Value
Home Financials for this Owner
Home Financials are based on the most recent Mortgage that was taken out on this home.
Original Mortgage
$16,000
Interest Rate
5.86%
Mortgage Type
New Conventional
Purchase Details
Closed on
Mar 16, 1990
Bought by
Mumphery Sammy L
Purchase Details
Closed on
Jan 7, 1986
Bought by
Overstreet Bill
Create a Home Valuation Report for This Property
The Home Valuation Report is an in-depth analysis detailing your home's value as well as a comparison with similar homes in the area
Home Values in the Area
Average Home Value in this Area
Purchase History
| Date | Buyer | Sale Price | Title Company |
|---|---|---|---|
| Mt Zion First African Baptist | $16,000 | -- | |
| Mumphery Sammy L | -- | -- | |
| Mumphery Sammy L Et | $14,500 | -- | |
| Overstreet Bill | $9,000 | -- |
Source: Public Records
Mortgage History
| Date | Status | Borrower | Loan Amount |
|---|---|---|---|
| Closed | Mt Zion First African Baptist | $16,000 |
Source: Public Records
Tax History Compared to Growth
Tax History
| Year | Tax Paid | Tax Assessment Tax Assessment Total Assessment is a certain percentage of the fair market value that is determined by local assessors to be the total taxable value of land and additions on the property. | Land | Improvement |
|---|---|---|---|---|
| 2024 | $218 | $6,086 | $833 | $5,253 |
| 2023 | $218 | $5,817 | $833 | $4,984 |
| 2022 | $147 | $5,549 | $833 | $4,716 |
| 2021 | $144 | $5,281 | $833 | $4,448 |
| 2020 | $149 | $5,281 | $833 | $4,448 |
| 2019 | $150 | $5,281 | $833 | $4,448 |
| 2018 | $170 | $5,775 | $1,167 | $4,608 |
| 2017 | $235 | $5,775 | $1,167 | $4,608 |
| 2016 | $171 | $5,775 | $1,167 | $4,608 |
| 2015 | -- | $5,775 | $1,167 | $4,608 |
| 2014 | -- | $5,775 | $1,167 | $4,608 |
| 2013 | -- | $5,775 | $1,166 | $4,608 |
Source: Public Records
Map
Nearby Homes