Estimated Value: $144,000 - $171,434
2
Beds
1
Bath
1,280
Sq Ft
$120/Sq Ft
Est. Value
About This Home
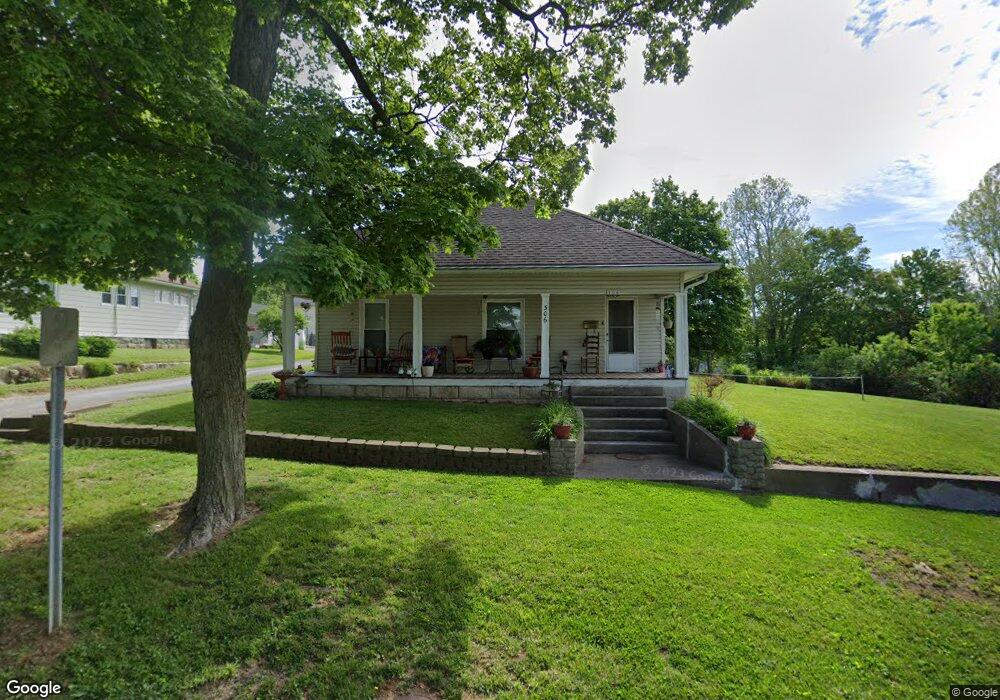
This home is located at 306 S High St, Salem, IN 47167 and is currently estimated at $153,859, approximately $120 per square foot. 306 S High St is a home located in Washington County with nearby schools including Bradie M. Shrum Lower Elementary School, Salem Middle School, and Salem High School.
Ownership History
Date
Name
Owned For
Owner Type
Purchase Details
Closed on
Nov 2, 2017
Sold by
Crandall Robert D
Bought by
Sanders Kristy D
Current Estimated Value
Home Financials for this Owner
Home Financials are based on the most recent Mortgage that was taken out on this home.
Original Mortgage
$25,000
Interest Rate
3.83%
Mortgage Type
New Conventional
Purchase Details
Closed on
Oct 20, 2017
Sold by
Cradall Robert D
Bought by
Sanders Kristy D
Home Financials for this Owner
Home Financials are based on the most recent Mortgage that was taken out on this home.
Original Mortgage
$25,000
Interest Rate
3.83%
Mortgage Type
New Conventional
Create a Home Valuation Report for This Property
The Home Valuation Report is an in-depth analysis detailing your home's value as well as a comparison with similar homes in the area
Home Values in the Area
Average Home Value in this Area
Purchase History
| Date | Buyer | Sale Price | Title Company |
|---|---|---|---|
| Sanders Kristy D | $60,400 | -- | |
| Sanders Kristy D | -- | None Available |
Source: Public Records
Mortgage History
| Date | Status | Borrower | Loan Amount |
|---|---|---|---|
| Closed | Sanders Kristy D | $25,000 |
Source: Public Records
Tax History Compared to Growth
Tax History
| Year | Tax Paid | Tax Assessment Tax Assessment Total Assessment is a certain percentage of the fair market value that is determined by local assessors to be the total taxable value of land and additions on the property. | Land | Improvement |
|---|---|---|---|---|
| 2024 | $2,310 | $115,500 | $12,100 | $103,400 |
| 2023 | $2,148 | $106,700 | $12,100 | $94,600 |
| 2022 | $1,946 | $96,600 | $12,100 | $84,500 |
| 2021 | $1,780 | $88,300 | $12,100 | $76,200 |
| 2020 | $876 | $84,800 | $12,100 | $72,700 |
| 2019 | $851 | $82,300 | $12,100 | $70,200 |
| 2018 | $797 | $76,900 | $12,100 | $64,800 |
| 2017 | $771 | $81,400 | $12,100 | $69,300 |
| 2016 | $575 | $76,600 | $12,100 | $64,500 |
| 2014 | $527 | $76,500 | $12,100 | $64,400 |
| 2013 | $476 | $73,700 | $12,100 | $61,600 |
Source: Public Records
Map
Nearby Homes
- 301 E Market St
- 52 Public Square
- (Tract 2) 5484 State Road 135
- 303 W Market St
- 412 Ridgeview Dr
- 701 S Main St
- 805 Smith St
- 404 E Mulberry St
- 0 S Side South Boston Pekin Rd
- 205 S Harrison St
- 406 W Mulberry St
- 115 Nichols Ave
- 104 Hounds Way
- 101, 103, & 105 Hounds Way
- 801 N College Ave
- 800 Hayes Ave
- 102 Mahuron Dr
- 808 Locust St
- 0 W Mulberry St
- 501 E Homer St