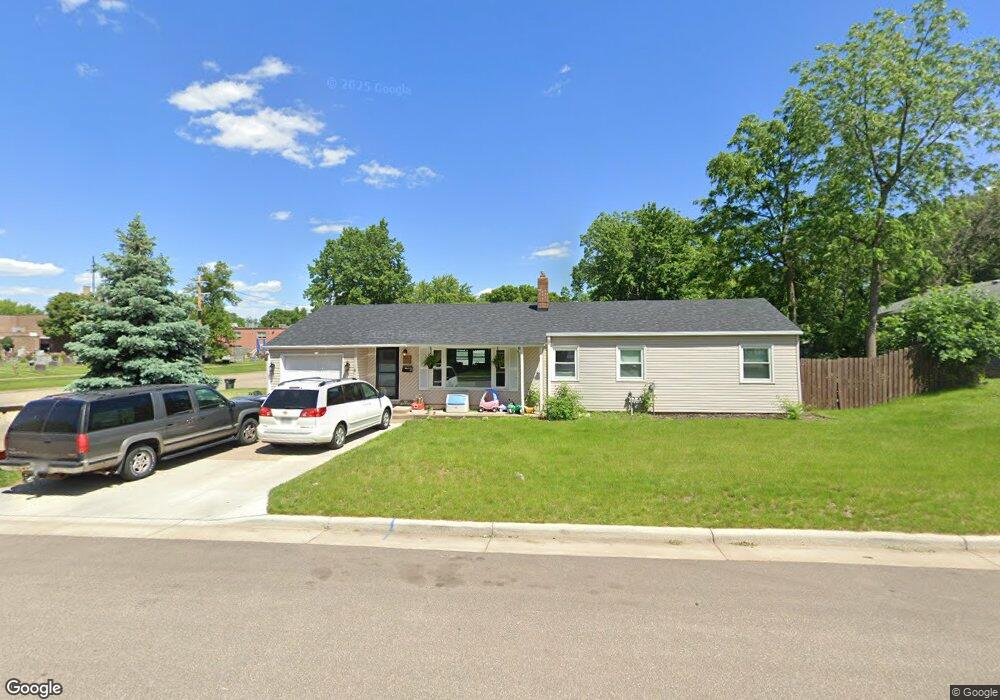
306 S Pierson Ave New Richmond, WI 54017
Estimated Value: $261,000 - $278,000
3
Beds
1
Bath
2,422
Sq Ft
$110/Sq Ft
Est. Value
About This Home
This home is located at 306 S Pierson Ave, New Richmond, WI 54017 and is currently estimated at $267,305, approximately $110 per square foot. 306 S Pierson Ave is a home located in St. Croix County with nearby schools including New Richmond High School and St. Mary School.
Ownership History
Date
Name
Owned For
Owner Type
Purchase Details
Closed on
Feb 12, 2021
Sold by
Winegar Lance and Winegar Bailey
Bought by
Burnett Noah
Current Estimated Value
Home Financials for this Owner
Home Financials are based on the most recent Mortgage that was taken out on this home.
Original Mortgage
$210,101
Outstanding Balance
$187,750
Interest Rate
2.65%
Mortgage Type
New Conventional
Estimated Equity
$79,555
Purchase Details
Closed on
Feb 10, 2017
Sold by
Slinker Schroeder Jannette L
Bought by
Wingegar Lance and Larson Bailey
Purchase Details
Closed on
Oct 28, 2016
Sold by
Reek Michael A and Reck Kathy S
Bought by
Schroeder Janette Slinker
Home Financials for this Owner
Home Financials are based on the most recent Mortgage that was taken out on this home.
Original Mortgage
$127,689
Interest Rate
3.42%
Mortgage Type
New Conventional
Purchase Details
Closed on
Jan 15, 2014
Sold by
Jensen Mary L
Bought by
Reck Michael A and Reck Kathy S
Create a Home Valuation Report for This Property
The Home Valuation Report is an in-depth analysis detailing your home's value as well as a comparison with similar homes in the area
Home Values in the Area
Average Home Value in this Area
Purchase History
| Date | Buyer | Sale Price | Title Company |
|---|---|---|---|
| Burnett Noah | $200,000 | St Croix County Abstract & T | |
| Wingegar Lance | $140,000 | St Croix County Abstract | |
| Schroeder Janette Slinker | $134,400 | None Available | |
| Reck Michael A | $120,000 | None Available |
Source: Public Records
Mortgage History
| Date | Status | Borrower | Loan Amount |
|---|---|---|---|
| Open | Burnett Noah | $210,101 | |
| Previous Owner | Schroeder Janette Slinker | $127,689 |
Source: Public Records
Tax History Compared to Growth
Tax History
| Year | Tax Paid | Tax Assessment Tax Assessment Total Assessment is a certain percentage of the fair market value that is determined by local assessors to be the total taxable value of land and additions on the property. | Land | Improvement |
|---|---|---|---|---|
| 2024 | $31 | $226,800 | $34,300 | $192,500 |
| 2023 | $3,023 | $223,900 | $34,300 | $189,600 |
| 2022 | $2,580 | $200,000 | $34,300 | $165,700 |
| 2021 | $2,354 | $178,200 | $34,300 | $143,900 |
| 2020 | $2,371 | $105,800 | $25,100 | $80,700 |
| 2019 | $2,263 | $105,800 | $25,100 | $80,700 |
| 2018 | $2,305 | $105,800 | $25,100 | $80,700 |
| 2017 | $2,205 | $105,800 | $25,100 | $80,700 |
| 2016 | $2,205 | $105,800 | $25,100 | $80,700 |
| 2015 | $2,248 | $105,800 | $25,100 | $80,700 |
| 2014 | $2,189 | $105,800 | $25,100 | $80,700 |
| 2013 | $2,148 | $105,800 | $25,100 | $80,700 |
Source: Public Records
Map
Nearby Homes
- 305 S Pierson Ave
- XXX 140th Ave
- 225 W 2nd St
- 236 W 5th St
- 425 W 8th St Unit 22
- 425 W 8th St Unit 20
- 425 W 8th St Unit 21
- 425 W 8th St Unit 19
- 425 W 8th St Unit 24
- 425 W 8th St Unit 23
- 1206 Pinecrest Rd
- 114 E 6th St Unit A
- 212 E 3rd St
- 941 W Edge Place Unit 14
- 637 Maple Ct
- 1016 W Ridge Ct
- 115 N Green Ave
- 217 N 2nd St
- 1142 W Edge Place
- 330 E 6th St
- 570 W 3rd St
- 326 S Pierson Ave
- 323 S Pierson Ave
- 1920 W 5th St
- 548 W 3rd St
- 265 S Pierson Ave
- 333 S Pierson Ave
- 347 S Pierson Ave
- 534 W 3rd St
- 368 S Pierson Ave
- 357 S Pierson Ave
- 343 S Washington Ave
- 376 S Pierson Ave
- 305 S Washington Ave
- 315 S Washington Ave
- 369 S Pierson Ave
- 355 S Washington Ave
- 329 S Washington Ave
- 563 W 4th St
- 371 S Washington Ave