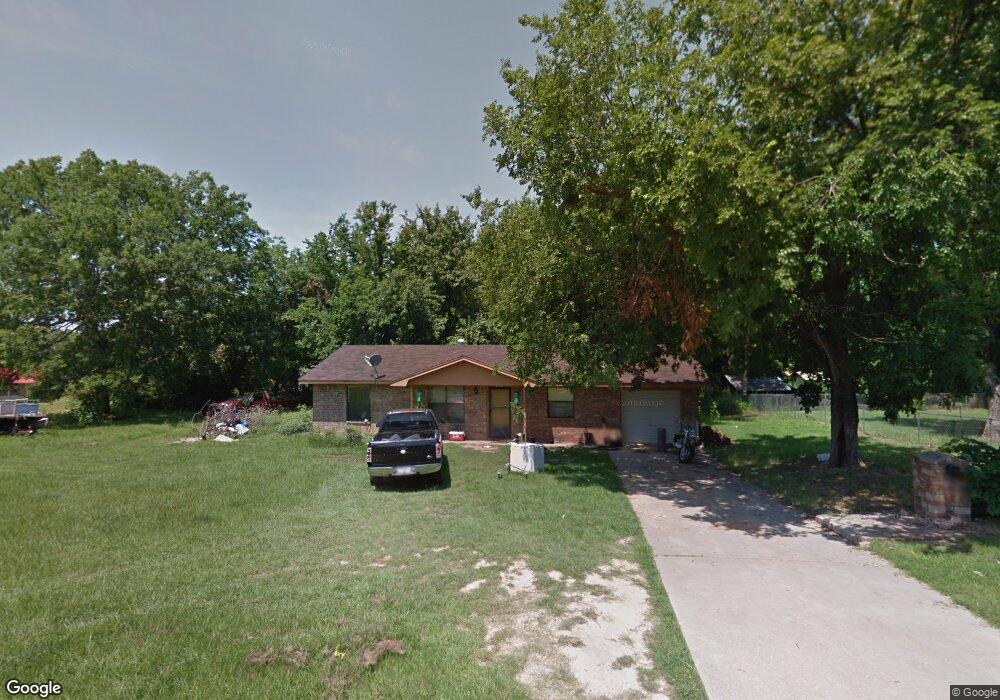
306 SE B St Antlers, OK 74523
Estimated Value: $77,210 - $116,000
2
Beds
1
Bath
1,050
Sq Ft
$95/Sq Ft
Est. Value
About This Home
This home is located at 306 SE B St, Antlers, OK 74523 and is currently estimated at $99,553, approximately $94 per square foot. 306 SE B St is a home located in Pushmataha County with nearby schools including Brantly Elementary School, Obuch Middle School, and Antlers High School.
Ownership History
Date
Name
Owned For
Owner Type
Purchase Details
Closed on
Jan 15, 2009
Sold by
Firstbank
Bought by
Johnson Dennis J
Current Estimated Value
Purchase Details
Closed on
Nov 14, 2008
Sold by
Mckaughan Michael Gene
Bought by
Firstbank
Purchase Details
Closed on
Jun 25, 2004
Sold by
Hamilton Lillie M
Bought by
Michael Gene Mckaughan
Purchase Details
Closed on
Dec 29, 1994
Sold by
Mayer Gerald
Bought by
Hamilton Lillie M
Purchase Details
Closed on
Feb 12, 1993
Sold by
Pipkin Anna Farr
Bought by
Mayer Gerald
Create a Home Valuation Report for This Property
The Home Valuation Report is an in-depth analysis detailing your home's value as well as a comparison with similar homes in the area
Home Values in the Area
Average Home Value in this Area
Purchase History
| Date | Buyer | Sale Price | Title Company |
|---|---|---|---|
| Johnson Dennis J | $35,000 | -- | |
| Firstbank | -- | -- | |
| Michael Gene Mckaughan | $32,500 | -- | |
| Hamilton Lillie M | $5,000 | -- | |
| Mayer Gerald | $3,000 | -- |
Source: Public Records
Tax History Compared to Growth
Tax History
| Year | Tax Paid | Tax Assessment Tax Assessment Total Assessment is a certain percentage of the fair market value that is determined by local assessors to be the total taxable value of land and additions on the property. | Land | Improvement |
|---|---|---|---|---|
| 2025 | $318 | $5,328 | $383 | $4,945 |
| 2024 | $318 | $5,328 | $377 | $4,951 |
| 2023 | $296 | $5,022 | $367 | $4,655 |
| 2022 | $285 | $4,877 | $362 | $4,515 |
| 2021 | $275 | $4,735 | $340 | $4,395 |
| 2020 | $264 | $4,596 | $318 | $4,278 |
| 2019 | $255 | $4,463 | $298 | $4,165 |
| 2018 | $245 | $4,333 | $282 | $4,051 |
| 2017 | $236 | $4,207 | $270 | $3,937 |
| 2016 | $227 | $4,084 | $273 | $3,811 |
| 2015 | $218 | $3,965 | $291 | $3,674 |
| 2014 | $210 | $3,850 | $433 | $3,417 |
Source: Public Records
Map
Nearby Homes