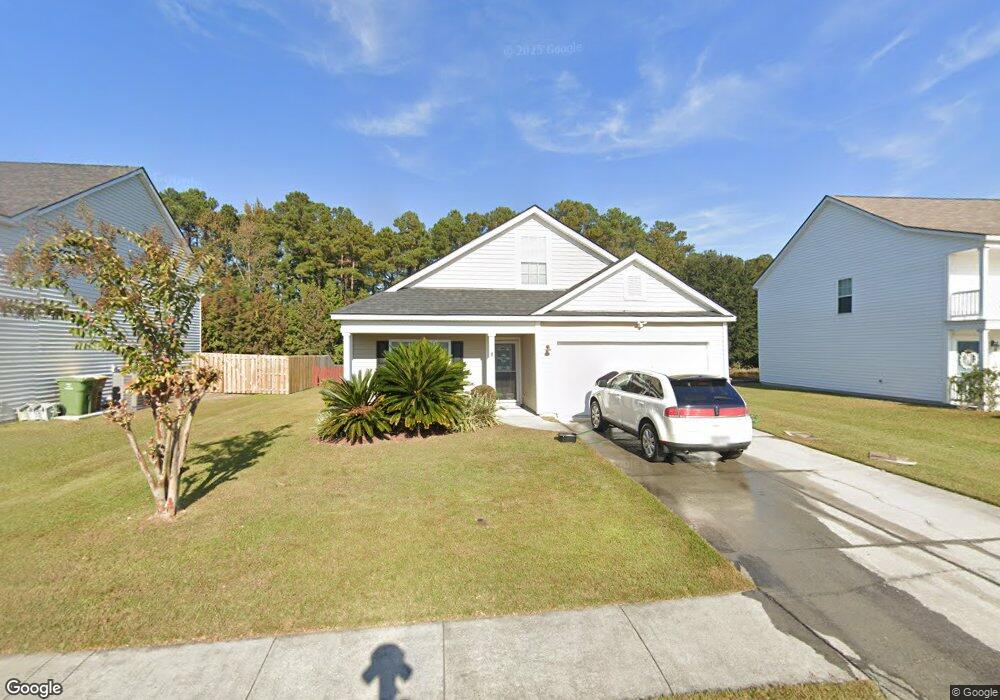
306 Southwilde Way Pooler, GA 31322
Estimated Value: $347,694 - $381,000
5
Beds
3
Baths
2,378
Sq Ft
$153/Sq Ft
Est. Value
About This Home
This home is located at 306 Southwilde Way, Pooler, GA 31322 and is currently estimated at $363,674, approximately $152 per square foot. 306 Southwilde Way is a home located in Chatham County with nearby schools including Groves High School and Savannah Adventist Christian School.
Ownership History
Date
Name
Owned For
Owner Type
Purchase Details
Closed on
Jul 31, 2018
Sold by
Washington Stanley
Bought by
Washington Stanley and Washington Gayle
Current Estimated Value
Home Financials for this Owner
Home Financials are based on the most recent Mortgage that was taken out on this home.
Original Mortgage
$88,000
Outstanding Balance
$76,424
Interest Rate
4.5%
Mortgage Type
New Conventional
Estimated Equity
$287,250
Purchase Details
Closed on
Sep 25, 2009
Sold by
Beazer Homes Corp
Bought by
Okonski Katherine
Home Financials for this Owner
Home Financials are based on the most recent Mortgage that was taken out on this home.
Original Mortgage
$199,678
Interest Rate
5.1%
Mortgage Type
VA
Purchase Details
Closed on
Feb 26, 2007
Sold by
Not Provided
Bought by
Okonski Katherine
Create a Home Valuation Report for This Property
The Home Valuation Report is an in-depth analysis detailing your home's value as well as a comparison with similar homes in the area
Home Values in the Area
Average Home Value in this Area
Purchase History
| Date | Buyer | Sale Price | Title Company |
|---|---|---|---|
| Washington Stanley | -- | -- | |
| Washington Stanley | $218,000 | -- | |
| Okonski Katherine | $193,300 | -- | |
| Okonski Katherine | $1,448,300 | -- |
Source: Public Records
Mortgage History
| Date | Status | Borrower | Loan Amount |
|---|---|---|---|
| Open | Washington Stanley | $88,000 | |
| Closed | Washington Stanley | $88,000 | |
| Previous Owner | Okonski Katherine | $199,678 |
Source: Public Records
Tax History Compared to Growth
Tax History
| Year | Tax Paid | Tax Assessment Tax Assessment Total Assessment is a certain percentage of the fair market value that is determined by local assessors to be the total taxable value of land and additions on the property. | Land | Improvement |
|---|---|---|---|---|
| 2025 | $1,121 | $137,160 | $24,000 | $113,160 |
| 2024 | $1,121 | $136,160 | $24,000 | $112,160 |
| 2023 | $863 | $116,160 | $10,000 | $106,160 |
| 2022 | $1,061 | $114,160 | $10,000 | $104,160 |
| 2021 | $1,206 | $98,640 | $10,000 | $88,640 |
| 2020 | $2,785 | $95,960 | $10,000 | $85,960 |
| 2019 | $2,785 | $87,200 | $9,766 | $77,434 |
| 2018 | $2,942 | $85,960 | $10,000 | $75,960 |
| 2017 | $2,573 | $80,360 | $10,000 | $70,360 |
| 2016 | $2,546 | $79,360 | $10,000 | $69,360 |
Source: Public Records
Map
Nearby Homes
- 312 Grasslands Dr
- 335 Winchester Dr
- 308 Grasslands Dr
- 310 Remington Place
- 108 Savanna Dr
- 101 Savanna Dr
- 365 Southwilde Way
- 445 Lions Den Dr
- 149 Tahoe Dr
- 103 Safari Trail
- 157 Tahoe Dr
- 168 Tahoe Dr
- 374 Southwilde Way
- 231 Tigers Paw Dr
- 203 Gazelle Ln
- 108 Tahoe Dr
- 138 Como Dr
- 140 Como Dr
- 137 Como Dr
- 144 Como Dr
- 304 Southwilde Way
- 308 Southwilde Way
- 302 Southwilde Way
- 310 Southwilde Way
- 307 Southwilde Way
- 309 Southwilde Way
- 305 Southwilde Way
- 303 Southwilde Way
- 300 Southwilde Way
- 312 Southwilde Way
- 311 Southwilde Way
- 301 Southwilde Way
- 314 Southwilde Way
- 406 Lions Den Dr
- 404 Lions Den Dr
- 408 Lions Den Dr
- 313 Southwilde Way
- 410 Lions Den Dr
- 402 Lions Den Dr
- 317 Grasslands Dr