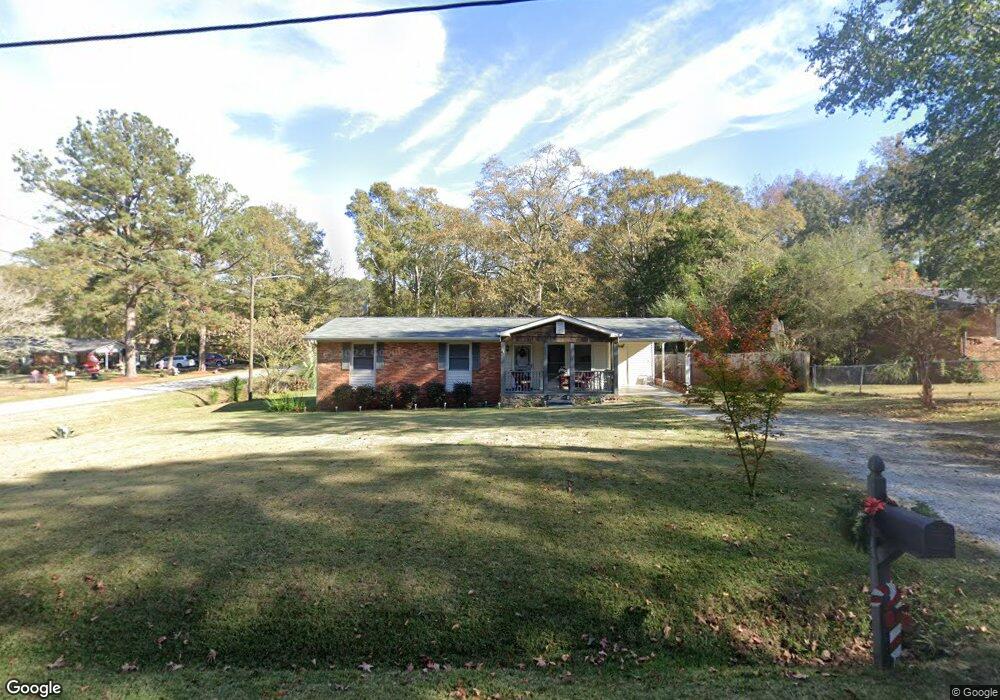
306 Swint Loop Ellerslie, GA 31807
Ellerslie NeighborhoodEstimated Value: $173,000 - $208,000
3
Beds
2
Baths
1,080
Sq Ft
$177/Sq Ft
Est. Value
About This Home
This home is located at 306 Swint Loop, Ellerslie, GA 31807 and is currently estimated at $190,768, approximately $176 per square foot. 306 Swint Loop is a home located in Harris County with nearby schools including Pine Ridge Elementary School, Harris County Carver Middle School, and Harris County High School.
Ownership History
Date
Name
Owned For
Owner Type
Purchase Details
Closed on
Oct 5, 2018
Sold by
Alderson Jodi L
Bought by
Brown Joann
Current Estimated Value
Home Financials for this Owner
Home Financials are based on the most recent Mortgage that was taken out on this home.
Original Mortgage
$111,111
Outstanding Balance
$96,294
Interest Rate
4.5%
Mortgage Type
New Conventional
Estimated Equity
$94,474
Purchase Details
Closed on
Feb 9, 2016
Sold by
Britt Sara F
Bought by
Alderson Jodi L and Alderson Jared C
Home Financials for this Owner
Home Financials are based on the most recent Mortgage that was taken out on this home.
Original Mortgage
$82,159
Interest Rate
3.92%
Mortgage Type
New Conventional
Purchase Details
Closed on
Nov 9, 2005
Sold by
Britt Earl N
Bought by
Britt Sara F
Purchase Details
Closed on
Oct 30, 2002
Sold by
Steele Troy A and Steele Elizabeth A
Bought by
Britt Earl N and Britt Sara F
Purchase Details
Closed on
Jul 25, 1991
Bought by
Steele Troy A and Steele Elizabeth A
Create a Home Valuation Report for This Property
The Home Valuation Report is an in-depth analysis detailing your home's value as well as a comparison with similar homes in the area
Home Values in the Area
Average Home Value in this Area
Purchase History
| Date | Buyer | Sale Price | Title Company |
|---|---|---|---|
| Brown Joann | $110,000 | -- | |
| Alderson Jodi L | $79,900 | -- | |
| Britt Sara F | $60,000 | -- | |
| Britt Earl N | $75,000 | -- | |
| Steele Troy A | $50,000 | -- |
Source: Public Records
Mortgage History
| Date | Status | Borrower | Loan Amount |
|---|---|---|---|
| Open | Brown Joann | $111,111 | |
| Previous Owner | Alderson Jodi L | $82,159 |
Source: Public Records
Tax History Compared to Growth
Tax History
| Year | Tax Paid | Tax Assessment Tax Assessment Total Assessment is a certain percentage of the fair market value that is determined by local assessors to be the total taxable value of land and additions on the property. | Land | Improvement |
|---|---|---|---|---|
| 2025 | $1,772 | $56,675 | $10,000 | $46,675 |
| 2024 | $1,531 | $51,892 | $10,000 | $41,892 |
| 2023 | $1,396 | $46,832 | $10,000 | $36,832 |
| 2022 | $1,396 | $46,832 | $10,000 | $36,832 |
| 2021 | $1,425 | $46,156 | $10,000 | $36,156 |
| 2020 | $1,348 | $43,380 | $10,000 | $33,380 |
| 2019 | $1,305 | $43,380 | $10,000 | $33,380 |
| 2018 | $1,012 | $31,736 | $8,400 | $23,336 |
| 2017 | $1,012 | $31,736 | $8,400 | $23,336 |
| 2016 | $1,021 | $35,296 | $8,400 | $26,896 |
| 2015 | $1,023 | $35,296 | $8,400 | $26,896 |
| 2014 | $540 | $35,296 | $8,400 | $26,896 |
| 2013 | -- | $34,158 | $8,400 | $25,758 |
Source: Public Records
Map
Nearby Homes
- 73 Dogwood Terrace
- 556 Douglas Dr
- 0 Maria Ln Unit LotWP001
- 0 Maria Ln Unit 10525789
- 443 Abberly Ln
- 54 Bridle Path
- Undefined Scott Rd
- 0 Scott Rd
- 1140 Central Church Rd
- 65 Buckeye Loop S
- 19881 Georgia 315
- 15 Village Pkwy
- 55 Bransford Ln
- 72 W Teddy Bear Ln
- 303 Rocky Springs Dr
- 178 Rolling Farm Way
- 0 Diamond Rd Unit 224108
- 680 Kristi Lynns Way
- 365 Fox Chase Trail
- 13145 Ga Highway 315