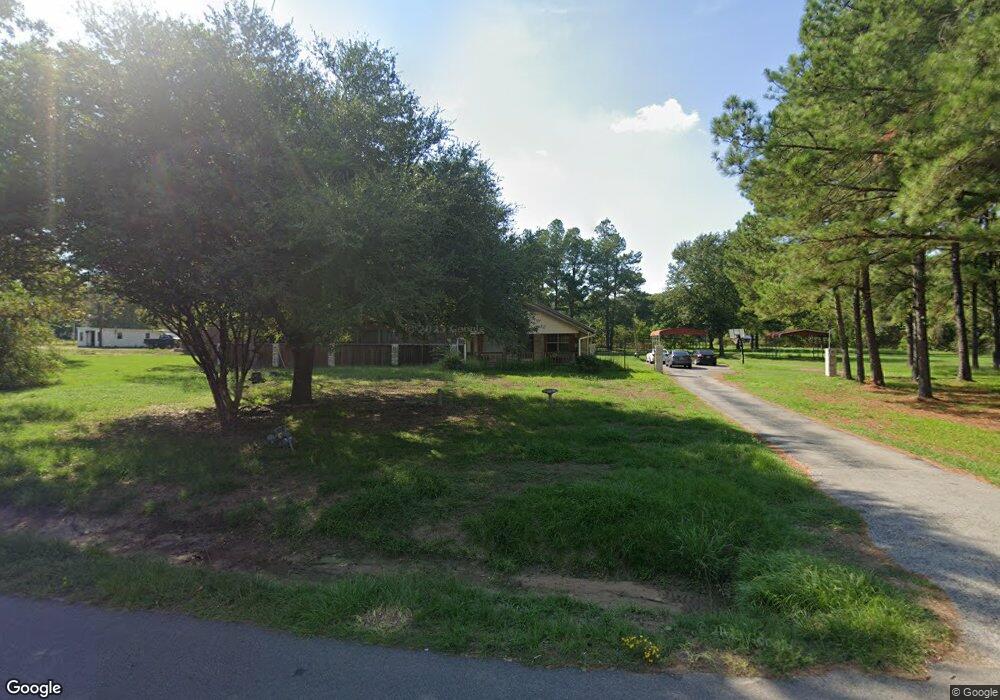
306 Tower Ln Lufkin, TX 75901
Estimated Value: $149,000 - $172,661
--
Bed
5
Baths
1,144
Sq Ft
$142/Sq Ft
Est. Value
About This Home
This home is located at 306 Tower Ln, Lufkin, TX 75901 and is currently estimated at $162,165, approximately $141 per square foot. 306 Tower Ln is a home located in Angelina County with nearby schools including Slack Elementary School, Burley Primary School, and Lufkin Middle School.
Ownership History
Date
Name
Owned For
Owner Type
Purchase Details
Closed on
Mar 26, 2024
Sold by
Barrios Alice Marie
Bought by
Barrios Robert
Current Estimated Value
Home Financials for this Owner
Home Financials are based on the most recent Mortgage that was taken out on this home.
Original Mortgage
$110,000
Outstanding Balance
$86,452
Interest Rate
6.64%
Mortgage Type
Seller Take Back
Estimated Equity
$75,713
Purchase Details
Closed on
May 17, 2017
Sold by
Barrios Robert Carlos
Bought by
Barrios Alice Marie
Purchase Details
Closed on
May 5, 2015
Sold by
Loomer James L
Bought by
Barrios Robert and Barrios Alice
Home Financials for this Owner
Home Financials are based on the most recent Mortgage that was taken out on this home.
Original Mortgage
$210,000
Interest Rate
3.84%
Mortgage Type
Seller Take Back
Purchase Details
Closed on
Oct 10, 2013
Sold by
Horton Ted J and Horton Lillie C
Bought by
Barrios Robert and Barrios Alice
Create a Home Valuation Report for This Property
The Home Valuation Report is an in-depth analysis detailing your home's value as well as a comparison with similar homes in the area
Home Values in the Area
Average Home Value in this Area
Purchase History
| Date | Buyer | Sale Price | Title Company |
|---|---|---|---|
| Barrios Robert | -- | Angelina Title | |
| Barrios Alice Marie | -- | None Available | |
| Barrios Robert | -- | None Available | |
| Barrios Robert | -- | None Available |
Source: Public Records
Mortgage History
| Date | Status | Borrower | Loan Amount |
|---|---|---|---|
| Open | Barrios Robert | $110,000 | |
| Previous Owner | Barrios Robert | $210,000 |
Source: Public Records
Tax History Compared to Growth
Tax History
| Year | Tax Paid | Tax Assessment Tax Assessment Total Assessment is a certain percentage of the fair market value that is determined by local assessors to be the total taxable value of land and additions on the property. | Land | Improvement |
|---|---|---|---|---|
| 2025 | $3,174 | $151,870 | $17,290 | $134,580 |
| 2024 | $3,141 | $150,290 | $17,290 | $133,000 |
| 2023 | $2,993 | $150,640 | $17,290 | $133,350 |
| 2022 | $3,175 | $139,410 | $17,290 | $122,120 |
| 2021 | $2,560 | $103,920 | $17,290 | $86,630 |
| 2020 | $2,378 | $96,750 | $17,290 | $79,460 |
| 2019 | $1,981 | $76,210 | $17,290 | $58,920 |
| 2018 | $1,721 | $74,430 | $17,290 | $57,140 |
| 2017 | $1,721 | $72,190 | $17,290 | $54,900 |
| 2016 | $1,701 | $71,370 | $17,290 | $54,080 |
| 2015 | $1,478 | $71,410 | $17,290 | $54,120 |
| 2014 | $1,478 | $68,080 | $17,290 | $50,790 |
Source: Public Records
Map
Nearby Homes