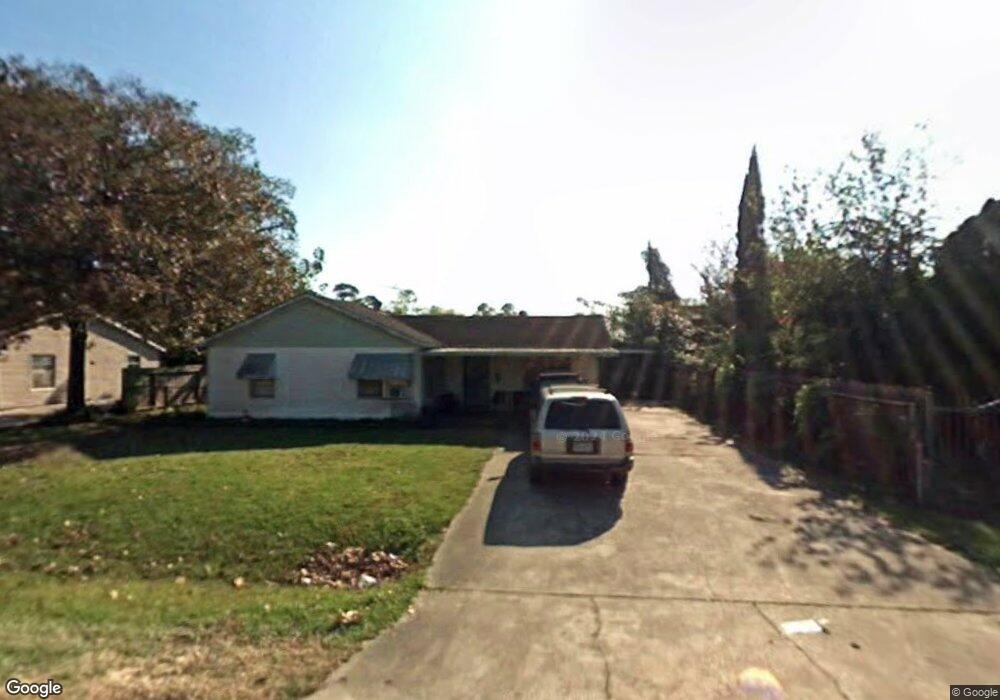
306 Twin Oaks St Houston, TX 77076
Northside-Northline NeighborhoodEstimated Value: $245,000 - $331,000
3
Beds
2
Baths
1,897
Sq Ft
$143/Sq Ft
Est. Value
About This Home
This home is located at 306 Twin Oaks St, Houston, TX 77076 and is currently estimated at $271,436, approximately $143 per square foot. 306 Twin Oaks St is a home located in Harris County with nearby schools including DeChaumes Elementary School, Fonville Middle School, and Sam Houston Math, Science & Technology Center.
Ownership History
Date
Name
Owned For
Owner Type
Purchase Details
Closed on
May 9, 2014
Sold by
Coronado Francisco Javier and Coronado Nicacia
Bought by
Coronado Francisco Mendoza
Current Estimated Value
Purchase Details
Closed on
Jun 15, 2011
Sold by
State Financial Services Springleaf Inc
Bought by
Coronado Francisco F and Coronado Nicacia
Purchase Details
Closed on
Apr 12, 2003
Sold by
Martinez Rodolfo and Lopez Manuela
Bought by
State Financial Services Springleaf Inc and Springleaf Financial Services Of Texas I
Purchase Details
Closed on
Aug 17, 2000
Sold by
Bender Benedict Ray and Bender Benedict Ray
Bought by
Martinez Rodolfo
Home Financials for this Owner
Home Financials are based on the most recent Mortgage that was taken out on this home.
Original Mortgage
$67,900
Interest Rate
8.15%
Create a Home Valuation Report for This Property
The Home Valuation Report is an in-depth analysis detailing your home's value as well as a comparison with similar homes in the area
Home Values in the Area
Average Home Value in this Area
Purchase History
| Date | Buyer | Sale Price | Title Company |
|---|---|---|---|
| Coronado Francisco Mendoza | -- | None Available | |
| Coronado Francisco F | -- | American Title Company | |
| State Financial Services Springleaf Inc | $74,000 | None Available | |
| Martinez Rodolfo | -- | First American Title |
Source: Public Records
Mortgage History
| Date | Status | Borrower | Loan Amount |
|---|---|---|---|
| Previous Owner | Martinez Rodolfo | $67,900 |
Source: Public Records
Tax History Compared to Growth
Tax History
| Year | Tax Paid | Tax Assessment Tax Assessment Total Assessment is a certain percentage of the fair market value that is determined by local assessors to be the total taxable value of land and additions on the property. | Land | Improvement |
|---|---|---|---|---|
| 2025 | $5,248 | $246,471 | $47,288 | $199,183 |
| 2024 | $5,248 | $251,329 | $47,288 | $204,041 |
| 2023 | $5,248 | $232,383 | $47,288 | $185,095 |
| 2022 | $4,090 | $182,000 | $36,375 | $145,625 |
| 2021 | $3,537 | $151,753 | $36,375 | $115,378 |
| 2020 | $2,882 | $125,580 | $36,375 | $89,205 |
| 2019 | $2,944 | $116,344 | $30,555 | $85,789 |
| 2018 | $2,531 | $100,033 | $30,555 | $69,478 |
| 2017 | $2,529 | $100,033 | $30,555 | $69,478 |
| 2016 | $2,409 | $95,276 | $30,555 | $64,721 |
| 2015 | $2,144 | $83,421 | $21,825 | $61,596 |
| 2014 | $2,144 | $83,421 | $21,825 | $61,596 |
Source: Public Records
Map
Nearby Homes
- 401 Cresline St
- 606 Cresline St
- 513 Mayford St
- 11018 Catamore St
- 11026 Catamore St
- 11018 Clark Rd
- 129 E Sunnyside St
- 11314 Courtshire Rd
- 153 Treasure Dr
- 11334 Carla St
- 107 Parker Rd
- 1002 Grenfell Ln
- 11320 Stonework Garden Ln
- 1105 Soren Ln
- 283 Turner Dr
- 11313 Stonework Grove Ln
- 59 E Sunnyside St
- 11325 Stonework Garden Ln
- 11317 Stonework Grove Ln
- 11319 Stonework Grove Ln
- 310 Twin Oaks St
- 10706 Bauman Rd Unit 1
- 402 Twin Oaks St
- 305 Twin Oaks St
- 309 Twin Oaks St
- 413 Parker Rd
- 406 Twin Oaks St
- 401 Twin Oaks St
- 415 Parker Rd
- 405 Twin Oaks St
- 410 Twin Oaks St
- 310 Cresline St
- 402 Cresline St
- 417 Parker Rd
- 308 Cresline St
- 409 Twin Oaks St
- 406 Parker Rd
- 273 Parker Rd
- 406 Cresline St
- 414 Twin Oaks St