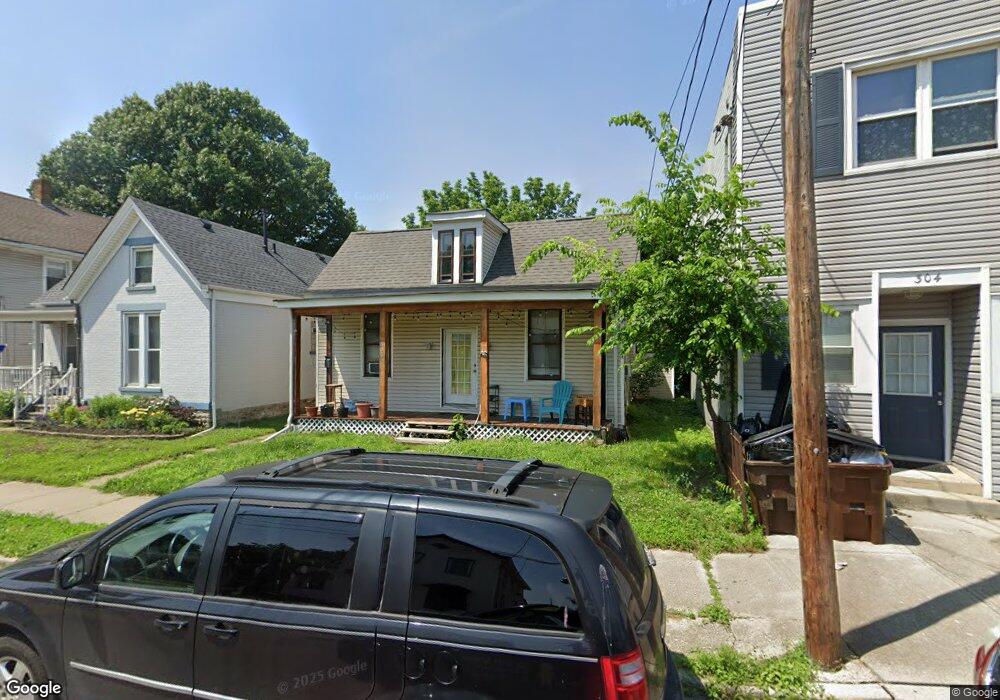
306 W Vine St Cincinnati, OH 45215
Estimated Value: $104,000 - $160,000
2
Beds
1
Bath
890
Sq Ft
$143/Sq Ft
Est. Value
About This Home
This home is located at 306 W Vine St, Cincinnati, OH 45215 and is currently estimated at $127,098, approximately $142 per square foot. 306 W Vine St is a home located in Hamilton County with nearby schools including Reading Community High School, Saints Peter and Paul Academy, and Mount Notre Dame High School.
Ownership History
Date
Name
Owned For
Owner Type
Purchase Details
Closed on
Dec 21, 2020
Sold by
Hendon Properties Ltd
Bought by
Lehmann Samuel J
Current Estimated Value
Purchase Details
Closed on
Feb 28, 2002
Sold by
Rein Don and Rein Melissa A
Bought by
Hendon Properties Ltd
Purchase Details
Closed on
Sep 5, 2001
Sold by
Va
Bought by
Rein Don and Meyer Henry
Purchase Details
Closed on
Apr 27, 2001
Sold by
Johnson Donald Paul and Doe Jane
Bought by
Countrywide Home Loans Inc
Purchase Details
Closed on
Aug 2, 1996
Sold by
Brinck Terry G and Brinck Phyllis J
Bought by
Johnson Donald Paul
Home Financials for this Owner
Home Financials are based on the most recent Mortgage that was taken out on this home.
Original Mortgage
$53,040
Interest Rate
8.33%
Mortgage Type
VA
Create a Home Valuation Report for This Property
The Home Valuation Report is an in-depth analysis detailing your home's value as well as a comparison with similar homes in the area
Home Values in the Area
Average Home Value in this Area
Purchase History
| Date | Buyer | Sale Price | Title Company |
|---|---|---|---|
| Lehmann Samuel J | $65,000 | None Available | |
| Hendon Properties Ltd | -- | -- | |
| Rein Don | -- | -- | |
| Countrywide Home Loans Inc | $45,828 | -- | |
| Johnson Donald Paul | $52,000 | Midland Title Security Inc |
Source: Public Records
Mortgage History
| Date | Status | Borrower | Loan Amount |
|---|---|---|---|
| Previous Owner | Johnson Donald Paul | $53,040 |
Source: Public Records
Tax History
| Year | Tax Paid | Tax Assessment Tax Assessment Total Assessment is a certain percentage of the fair market value that is determined by local assessors to be the total taxable value of land and additions on the property. | Land | Improvement |
|---|---|---|---|---|
| 2025 | $1,234 | $22,716 | $8,299 | $14,417 |
| 2023 | $1,231 | $22,716 | $8,299 | $14,417 |
| 2022 | $1,114 | $15,971 | $6,671 | $9,300 |
| 2021 | $1,104 | $15,971 | $6,671 | $9,300 |
| 2020 | $940 | $15,971 | $6,671 | $9,300 |
| 2019 | $916 | $14,134 | $5,905 | $8,229 |
| 2018 | $916 | $14,134 | $5,905 | $8,229 |
| 2017 | $875 | $14,134 | $5,905 | $8,229 |
| 2016 | $1,056 | $16,905 | $6,258 | $10,647 |
| 2015 | $1,051 | $16,905 | $6,258 | $10,647 |
| 2014 | $923 | $16,905 | $6,258 | $10,647 |
| 2013 | $935 | $17,248 | $6,384 | $10,864 |
Source: Public Records
Map
Nearby Homes
- 329 Walnut St
- 1401 Jefferson Ave
- 129 Pike St
- 1421 Jefferson Ave
- 310 E Vine St
- 654 3rd St
- 1521 Hunt Rd
- 311 Southern Ave
- 321 Southern Ave
- 415 Arlington Ave
- 217 W Wyoming Ave
- 334 Williams St
- 9350 Reading Rd
- 1612 Hunt Rd
- 18 Gahl Terrace
- 54 Gorman Ln
- 26 Gahl Terrace
- 0 Hill St Unit 1616370
- 519 Westview Ave
- 234 Mcguire Ln
- 304 W Vine St
- 310 W Vine St
- 300 W Vine St
- 302 W Vine St
- 312 W Vine St
- 1207 Jefferson Ave
- 1204 Jefferson Ave
- 1204 Jefferson Ave Unit 1204
- 320 W Vine St
- 313 W Vine St
- 244 W Vine St Unit 244 west vine st
- 307 W Vine St
- 1211 Jefferson Ave
- 311 W Vine St
- 315 W Vine St
- 240 W Vine St
- 322 W Vine St
- 243 W Vine St
- 309 Walnut St
- 321 W Vine St
Your Personal Tour Guide
Ask me questions while you tour the home.