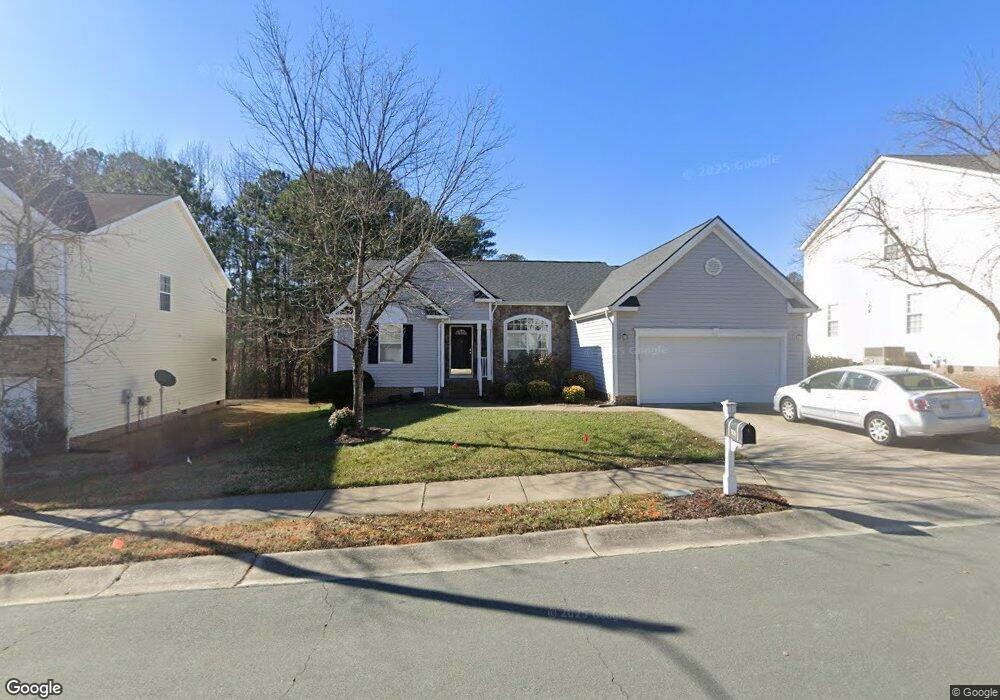
306 Whitney Ln Durham, NC 27713
Woodcroft NeighborhoodEstimated Value: $463,000 - $541,000
3
Beds
2
Baths
2,005
Sq Ft
$247/Sq Ft
Est. Value
About This Home
This home is located at 306 Whitney Ln, Durham, NC 27713 and is currently estimated at $495,380, approximately $247 per square foot. 306 Whitney Ln is a home located in Durham County with nearby schools including Pearsontown Elementary School, Lowe's Grove Middle, and Hillside High School.
Ownership History
Date
Name
Owned For
Owner Type
Purchase Details
Closed on
Jan 14, 2015
Sold by
Walker Carolyn T
Bought by
Hubbe Allen B and Arenaza Miriam Rojas
Current Estimated Value
Home Financials for this Owner
Home Financials are based on the most recent Mortgage that was taken out on this home.
Original Mortgage
$247,000
Outstanding Balance
$189,470
Interest Rate
3.88%
Mortgage Type
New Conventional
Estimated Equity
$305,910
Purchase Details
Closed on
Apr 30, 2003
Sold by
M/I Schottenstein Homes Inc
Bought by
Walker Carolyn T
Home Financials for this Owner
Home Financials are based on the most recent Mortgage that was taken out on this home.
Original Mortgage
$142,000
Interest Rate
5.79%
Create a Home Valuation Report for This Property
The Home Valuation Report is an in-depth analysis detailing your home's value as well as a comparison with similar homes in the area
Home Values in the Area
Average Home Value in this Area
Purchase History
| Date | Buyer | Sale Price | Title Company |
|---|---|---|---|
| Hubbe Allen B | $260,000 | None Available | |
| Walker Carolyn T | $235,000 | -- |
Source: Public Records
Mortgage History
| Date | Status | Borrower | Loan Amount |
|---|---|---|---|
| Open | Hubbe Allen B | $247,000 | |
| Previous Owner | Walker Carolyn T | $142,000 |
Source: Public Records
Tax History
| Year | Tax Paid | Tax Assessment Tax Assessment Total Assessment is a certain percentage of the fair market value that is determined by local assessors to be the total taxable value of land and additions on the property. | Land | Improvement |
|---|---|---|---|---|
| 2025 | $4,919 | $496,266 | $126,000 | $370,266 |
| 2024 | $3,745 | $268,448 | $54,090 | $214,358 |
| 2023 | $3,516 | $268,448 | $54,090 | $214,358 |
| 2022 | $3,436 | $268,448 | $54,090 | $214,358 |
| 2021 | $3,420 | $268,448 | $54,090 | $214,358 |
| 2020 | $3,339 | $268,448 | $54,090 | $214,358 |
| 2019 | $3,339 | $268,448 | $54,090 | $214,358 |
| 2018 | $3,207 | $236,412 | $49,000 | $187,412 |
| 2017 | $3,183 | $236,412 | $49,000 | $187,412 |
| 2016 | $3,076 | $236,412 | $49,000 | $187,412 |
| 2015 | $3,210 | $231,910 | $51,787 | $180,123 |
| 2014 | $3,210 | $231,910 | $51,787 | $180,123 |
Source: Public Records
Map
Nearby Homes
- 1129 Pebble Creek Crossing
- 1 Chownings St
- 1142 Metropolitan Dr
- 32 Brafferton Ct
- 1001 Pebble Creek Crossing Unit 11
- 1303 Crimson Creek Dr
- 6500 Amber Springs Dr
- 1003 Canary Pepper Dr
- 1101 Canary Pepper Dr
- 6519 Amber Springs Dr
- 1038 Laceflower Dr
- 3010 Dunnock Dr
- 6502 Barbee Rd
- 1039 Laceflower Dr
- 3105 Dunnock Dr
- 1049 Laceflower Dr
- 909 Windcrest Rd
- 12 Byerly Ct
- 804 Carpenter Fletcher Rd
- 806 Carpenter Fletcher Rd
- 308 Whitney Ln
- 304 Whitney Ln
- 310 Whitney Ln
- 302 Whitney Ln
- 307 Whitney Ln
- 305 Whitney Ln
- 309 Whitney Ln
- 303 Whitney Ln
- 312 Whitney Ln
- 1150 Pebble Creek Crossing
- 311 Whitney Ln
- 301 Whitney Ln
- 1208 Mallory Ln
- 1206 Mallory Ln
- 1148 Pebble Creek Crossing
- 1302 Mallory Ln
- 314 Whitney Ln
- 1304 Mallory Ln
- 313 Whitney Ln
- 1146 Pebble Creek Crossing
Your Personal Tour Guide
Ask me questions while you tour the home.