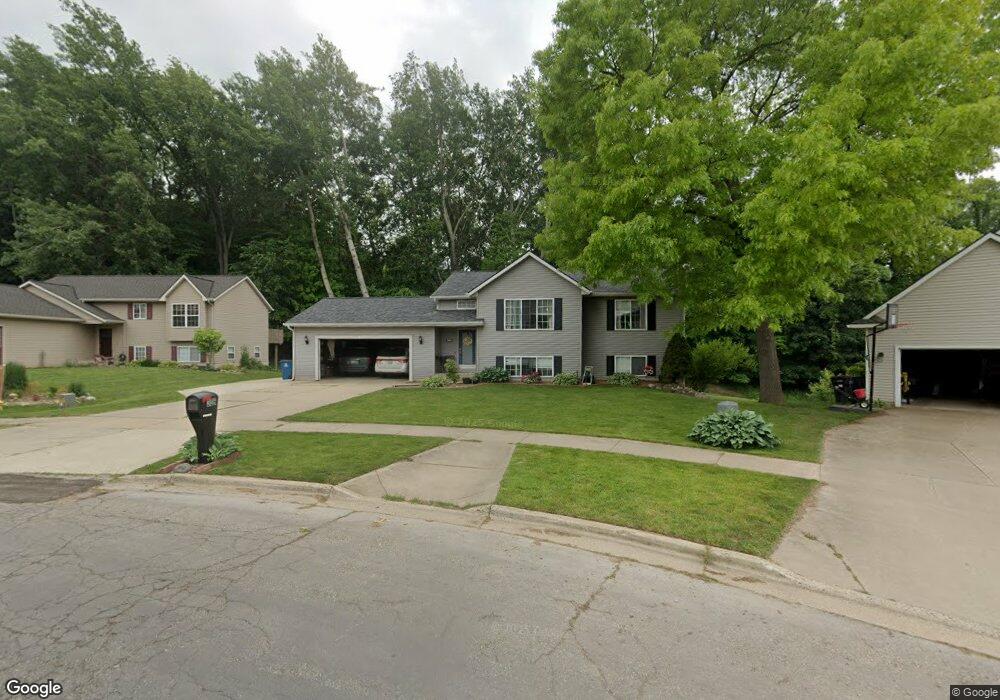
306 Willow Run Wayland, MI 49348
Estimated Value: $322,000 - $346,000
4
Beds
2
Baths
2,200
Sq Ft
$153/Sq Ft
Est. Value
About This Home
This home is located at 306 Willow Run, Wayland, MI 49348 and is currently estimated at $335,749, approximately $152 per square foot. 306 Willow Run is a home located in Allegan County with nearby schools including Wayland High School and St. Therese Catholic School.
Ownership History
Date
Name
Owned For
Owner Type
Purchase Details
Closed on
Jun 22, 2021
Sold by
Steketee Matthew A and Steketee Autumn R
Bought by
Terrell John and Terrell Katie
Current Estimated Value
Home Financials for this Owner
Home Financials are based on the most recent Mortgage that was taken out on this home.
Original Mortgage
$208,000
Outstanding Balance
$187,907
Interest Rate
2.9%
Mortgage Type
New Conventional
Estimated Equity
$147,842
Purchase Details
Closed on
Sep 21, 2009
Sold by
Gonzales William J and Gonzales Greta G
Bought by
Steketee Matthew A and Steketee Autumn R
Home Financials for this Owner
Home Financials are based on the most recent Mortgage that was taken out on this home.
Original Mortgage
$148,015
Interest Rate
5.38%
Mortgage Type
FHA
Purchase Details
Closed on
Jul 29, 1999
Bought by
Geers Bros Builders Inc
Create a Home Valuation Report for This Property
The Home Valuation Report is an in-depth analysis detailing your home's value as well as a comparison with similar homes in the area
Home Values in the Area
Average Home Value in this Area
Purchase History
| Date | Buyer | Sale Price | Title Company |
|---|---|---|---|
| Terrell John | $270,000 | Chicago Title Of Mi Inc | |
| Steketee Matthew A | $150,750 | Chicago Title Of Michigan | |
| Geers Bros Builders Inc | $25,000 | -- | |
| Geers Bros Builders Inc | $25,000 | -- | |
| Gonzales Wm | $120,000 | -- |
Source: Public Records
Mortgage History
| Date | Status | Borrower | Loan Amount |
|---|---|---|---|
| Open | Terrell John | $208,000 | |
| Previous Owner | Steketee Matthew A | $148,015 |
Source: Public Records
Tax History Compared to Growth
Tax History
| Year | Tax Paid | Tax Assessment Tax Assessment Total Assessment is a certain percentage of the fair market value that is determined by local assessors to be the total taxable value of land and additions on the property. | Land | Improvement |
|---|---|---|---|---|
| 2025 | $5,093 | $128,900 | $15,900 | $113,000 |
| 2024 | $4,699 | $114,100 | $12,700 | $101,400 |
| 2023 | $4,699 | $117,900 | $12,700 | $105,200 |
| 2022 | $4,699 | $105,200 | $12,700 | $92,500 |
| 2021 | $3,099 | $96,600 | $12,700 | $83,900 |
| 2020 | $3,099 | $92,300 | $12,700 | $79,600 |
| 2019 | $2,838 | $83,200 | $12,700 | $70,500 |
| 2018 | $2,838 | $77,700 | $12,700 | $65,000 |
| 2017 | $0 | $75,900 | $12,700 | $63,200 |
| 2016 | $0 | $66,500 | $12,700 | $53,800 |
| 2015 | -- | $66,500 | $12,700 | $53,800 |
| 2014 | -- | $62,400 | $13,900 | $48,500 |
| 2013 | -- | $60,600 | $13,900 | $46,700 |
Source: Public Records
Map
Nearby Homes
- 621 S Main St
- 110 E Sycamore St
- 330 Lotz Ct
- 146 Hanlon Ct
- 835 Wild Flower Ct
- 3282 Stonehill Ct
- 212 E Superior St
- 3296 Stonehill Ct
- 319 Alpine St
- 219 Alpine St
- 545 N Main St
- 3610 Garden St
- 1143 Regina Trail
- 3570 Windsor Woods Dr
- 4674 12th St
- 3770 Division Ave S
- 3685 Calkins Ct
- 3214 7th St
- 986 129th Ave
- 3897 Division St
- 312 Willow Run
- 306 Willow Run Dr
- 311 Willow Run
- 318 Willow Run
- 838 Meadow Dr
- 832 Meadow Dr
- 324 Willow Run
- 317 Willow Run
- 826 Meadow Dr
- 330 Willow Run
- 820 Meadow Dr
- 318 Meadow Ct
- 323 Willow Run
- 312 Meadow Ct
- 324 Meadow Ct
- 814 Meadow Dr
- 336 Willow Run
- 329 Willow Run
- 348 Willow Run Dr
- 354 Willow Run Dr