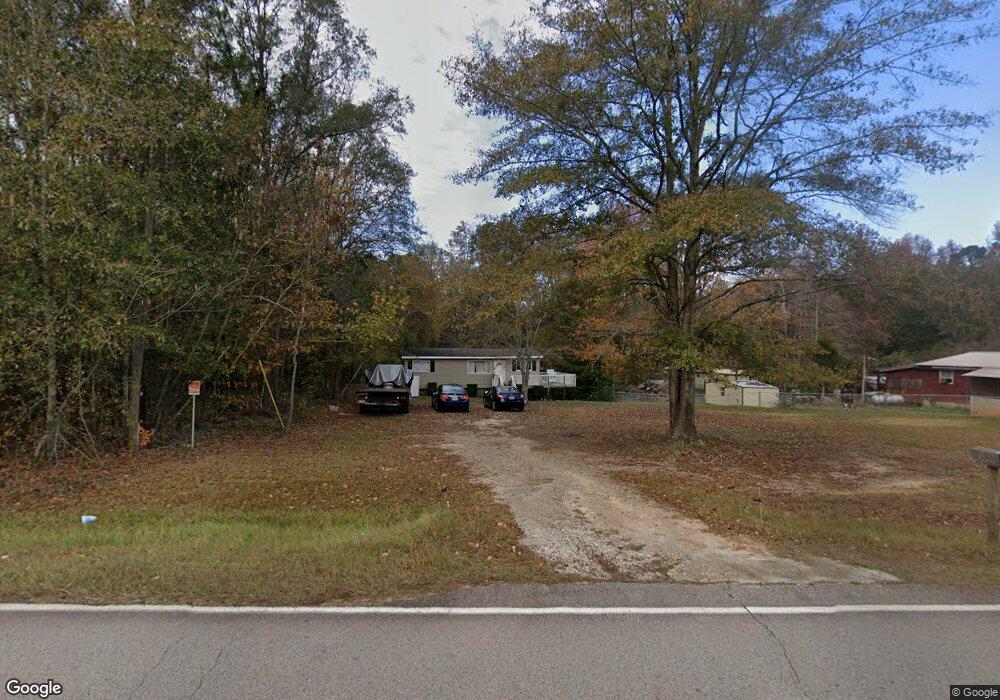
3060 Bartley Rd Lagrange, GA 30240
Estimated Value: $77,000 - $202,000
2
Beds
2
Baths
840
Sq Ft
$144/Sq Ft
Est. Value
About This Home
This home is located at 3060 Bartley Rd, Lagrange, GA 30240 and is currently estimated at $120,667, approximately $143 per square foot. 3060 Bartley Rd is a home located in Troup County with nearby schools including Long Cane Elementary School, Whitesville Road Elementary School, and West Point Elementary School.
Ownership History
Date
Name
Owned For
Owner Type
Purchase Details
Closed on
Mar 23, 2021
Sold by
Bryan W W Pete
Bought by
Reyes Rigoberto N
Current Estimated Value
Purchase Details
Closed on
Nov 6, 2017
Sold by
Tucker Christopher William
Bought by
Pete Bryan W W
Purchase Details
Closed on
Aug 28, 2009
Sold by
Bryan W W Pete
Bought by
Tucker Christopher William
Purchase Details
Closed on
Mar 22, 2007
Sold by
Barnes David
Bought by
Bryan W W Pete
Purchase Details
Closed on
Aug 4, 2003
Sold by
Wayne Bradley
Bought by
Barmes David
Purchase Details
Closed on
Mar 9, 1998
Sold by
James H Bowles
Bought by
Wayne Bradley
Purchase Details
Closed on
Sep 23, 1983
Sold by
Finley M
Bought by
James H Bowles
Purchase Details
Closed on
Jan 18, 1980
Sold by
Finley C
Bought by
Finley M
Purchase Details
Closed on
Jan 1, 1972
Sold by
Givins Mary and Givins C
Bought by
Finley C
Purchase Details
Closed on
Nov 1, 1970
Sold by
Austin Betty
Bought by
Givins Mary and Givins C
Create a Home Valuation Report for This Property
The Home Valuation Report is an in-depth analysis detailing your home's value as well as a comparison with similar homes in the area
Purchase History
| Date | Buyer | Sale Price | Title Company |
|---|---|---|---|
| Reyes Rigoberto N | $45,000 | -- | |
| Pete Bryan W W | $68,000 | -- | |
| Tucker Christopher William | $70,000 | -- | |
| Tucker Christopher William | $70,000 | -- | |
| Bryan W W Pete | $15,000 | -- | |
| Barmes David | $7,500 | -- | |
| Wayne Bradley | $10,000 | -- | |
| James H Bowles | $6,500 | -- | |
| Finley M | -- | -- | |
| Finley C | $4,000 | -- | |
| Givins Mary | $2,800 | -- |
Source: Public Records
Tax History
| Year | Tax Paid | Tax Assessment Tax Assessment Total Assessment is a certain percentage of the fair market value that is determined by local assessors to be the total taxable value of land and additions on the property. | Land | Improvement |
|---|---|---|---|---|
| 2025 | $823 | $30,160 | $3,280 | $26,880 |
| 2024 | $688 | $25,240 | $3,280 | $21,960 |
| 2023 | $568 | $500 | $0 | $500 |
| 2022 | $502 | $20,040 | $3,280 | $16,760 |
| 2021 | $530 | $17,560 | $2,400 | $15,160 |
| 2020 | $385 | $12,760 | $2,400 | $10,360 |
| 2019 | $409 | $13,560 | $1,920 | $11,640 |
| 2018 | $425 | $14,080 | $2,600 | $11,480 |
| 2017 | $425 | $14,080 | $2,600 | $11,480 |
| 2016 | $413 | $13,710 | $2,600 | $11,110 |
| 2015 | $414 | $13,710 | $2,600 | $11,110 |
| 2014 | $397 | $13,126 | $2,600 | $10,526 |
| 2013 | -- | $13,955 | $2,600 | $11,355 |
Source: Public Records
Map
Nearby Homes
- 215 Harris Walk
- 211 Harris Walk
- 223 Harris Walk
- 209 Harris Walk
- 225 Harris Walk
- 221 Harris Walk
- 145 Jarrell Hogg Rd
- 101 Garden Walk
- 101 Garden Walk Unit 85
- 107 Amhurst Dr
- 4172 Bartley Rd
- 0 Cannonville Rd
- 648 Warner Rd
- 0 Warner Rd Unit 10686116
- 1605 Bartley Rd
- Sandtown Road Unit: 1 2+ - Acre
- 0 Sandtown Rd Unit 10255987
- 3913 Whitesville Rd
- 620 Old Hutchinson Mill Rd
- 0 Johns Rd Unit 10615130
- 3030 Bartley Rd
- 3020 Bartley Rd
- 3028 Bartley Rd
- 3100 Bartley Rd
- 3130 Bartley Rd
- 3164 Bartley Rd
- 3180 Bartley Rd
- 3192 Bartley Rd
- 3033 Bartley Rd
- 3151 Bartley Rd
- 2907 Bartley Rd
- 3165 Bartley Rd
- 2884 Bartley Rd
- 2859 Bartley Rd
- 23 Baughs Cross Rd
- 0 Bartley Rd Unit 3139285
- 2823 Bartley Rd
- 0 Baughs Cross Rd Unit 20036287
- 0 Baughs Cross Rd Unit 7580140
- 0 Baughs Cross Rd Unit 7423411
Your Personal Tour Guide
Ask me questions while you tour the home.