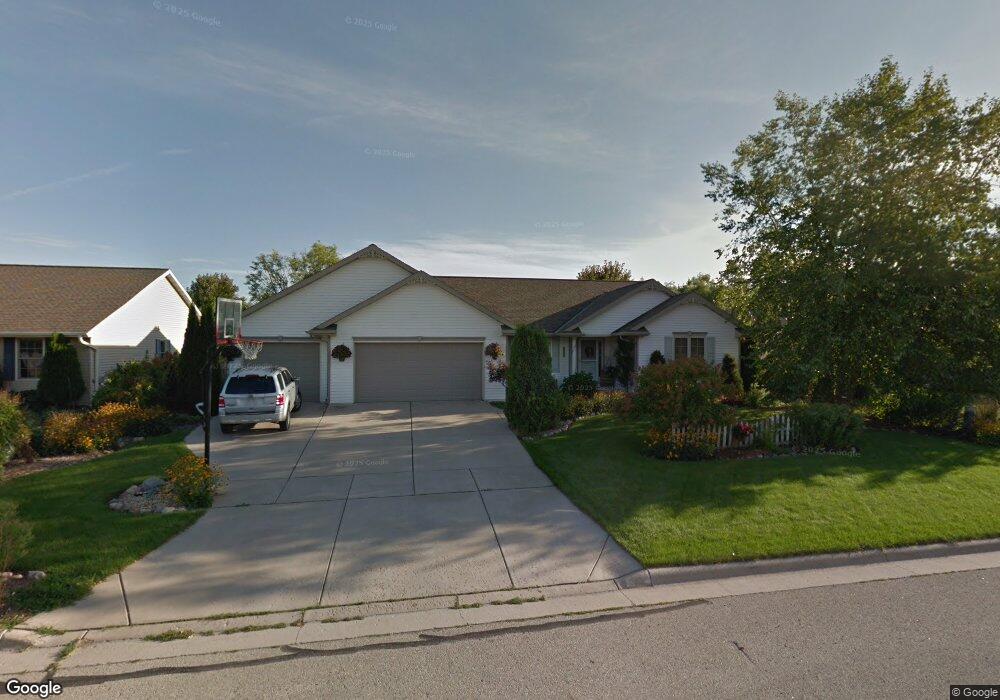
3060 Beth Dr Green Bay, WI 54311
McAuliffe Park NeighborhoodEstimated Value: $394,000 - $474,000
4
Beds
3
Baths
2,733
Sq Ft
$159/Sq Ft
Est. Value
About This Home
This home is located at 3060 Beth Dr, Green Bay, WI 54311 and is currently estimated at $433,194, approximately $158 per square foot. 3060 Beth Dr is a home located in Brown County with nearby schools including Martin Elementary School, Preble High School, and Royal Montessori Academy.
Ownership History
Date
Name
Owned For
Owner Type
Purchase Details
Closed on
Mar 25, 2010
Sold by
Schenk Craig A and Schenk Mary Beth
Bought by
Luepke Jeffrey R and Luepke Kelly R
Current Estimated Value
Home Financials for this Owner
Home Financials are based on the most recent Mortgage that was taken out on this home.
Original Mortgage
$184,000
Outstanding Balance
$122,256
Interest Rate
5.03%
Mortgage Type
New Conventional
Estimated Equity
$310,938
Purchase Details
Closed on
Jul 26, 2004
Sold by
Johnny B Home Construction Inc
Bought by
Schenk Craig A and Schenk Mary Beth
Home Financials for this Owner
Home Financials are based on the most recent Mortgage that was taken out on this home.
Original Mortgage
$144,000
Interest Rate
6.4%
Mortgage Type
Unknown
Purchase Details
Closed on
Dec 23, 2003
Sold by
Sitka Development Llc
Bought by
Johnny B Home Construction Inc
Create a Home Valuation Report for This Property
The Home Valuation Report is an in-depth analysis detailing your home's value as well as a comparison with similar homes in the area
Home Values in the Area
Average Home Value in this Area
Purchase History
| Date | Buyer | Sale Price | Title Company |
|---|---|---|---|
| Luepke Jeffrey R | $230,000 | Liberty Title | |
| Schenk Craig A | $202,700 | Bay Title & Abstract | |
| Johnny B Home Construction Inc | $305,300 | Bay Title & Abstract |
Source: Public Records
Mortgage History
| Date | Status | Borrower | Loan Amount |
|---|---|---|---|
| Open | Luepke Jeffrey R | $184,000 | |
| Previous Owner | Schenk Craig A | $144,000 |
Source: Public Records
Tax History Compared to Growth
Tax History
| Year | Tax Paid | Tax Assessment Tax Assessment Total Assessment is a certain percentage of the fair market value that is determined by local assessors to be the total taxable value of land and additions on the property. | Land | Improvement |
|---|---|---|---|---|
| 2024 | $5,826 | $307,200 | $43,900 | $263,300 |
| 2023 | $5,590 | $307,200 | $43,900 | $263,300 |
| 2022 | $5,448 | $307,200 | $43,900 | $263,300 |
| 2021 | $4,503 | $194,000 | $34,000 | $160,000 |
| 2020 | $4,537 | $194,000 | $34,000 | $160,000 |
| 2019 | $4,403 | $194,000 | $34,000 | $160,000 |
| 2018 | $4,296 | $194,000 | $34,000 | $160,000 |
| 2017 | $4,231 | $194,000 | $34,000 | $160,000 |
| 2016 | $4,167 | $194,000 | $34,000 | $160,000 |
| 2015 | $4,258 | $194,000 | $34,000 | $160,000 |
| 2014 | $4,408 | $194,000 | $34,000 | $160,000 |
| 2013 | $4,408 | $194,000 | $34,000 | $160,000 |
Source: Public Records
Map
Nearby Homes
- 3060 Gilbert Dr
- 3076 Gilbert Dr
- 3069 Gilbert Dr
- 473 Ontario Rd
- 442 Robert Ln
- 2730 Castaway Ct
- 3411 Sitka St
- 3410 Sitka St
- 3424 Sitka St
- 3416 Sitka St
- 3129 Finger Rd
- 3235 Hickory Ridge Ln
- 3234 W Twin Pines Ct
- 3261 Highland View Ln
- 537 Edward Dr
- 0 Lowell Dr
- 3353 Sitka St
- 537 Alpine Dr
- 2722 Finger Rd
- 2737 Canyon Bluff Rd