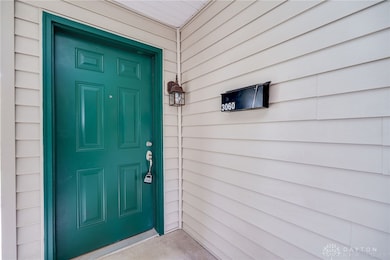
3060 Bright Bounty Ln Unit 13 Dayton, OH 45449
Estimated payment $1,198/month
Highlights
- Patio
- Central Air
- Heating System Uses Natural Gas
- Bathroom on Main Level
About This Home
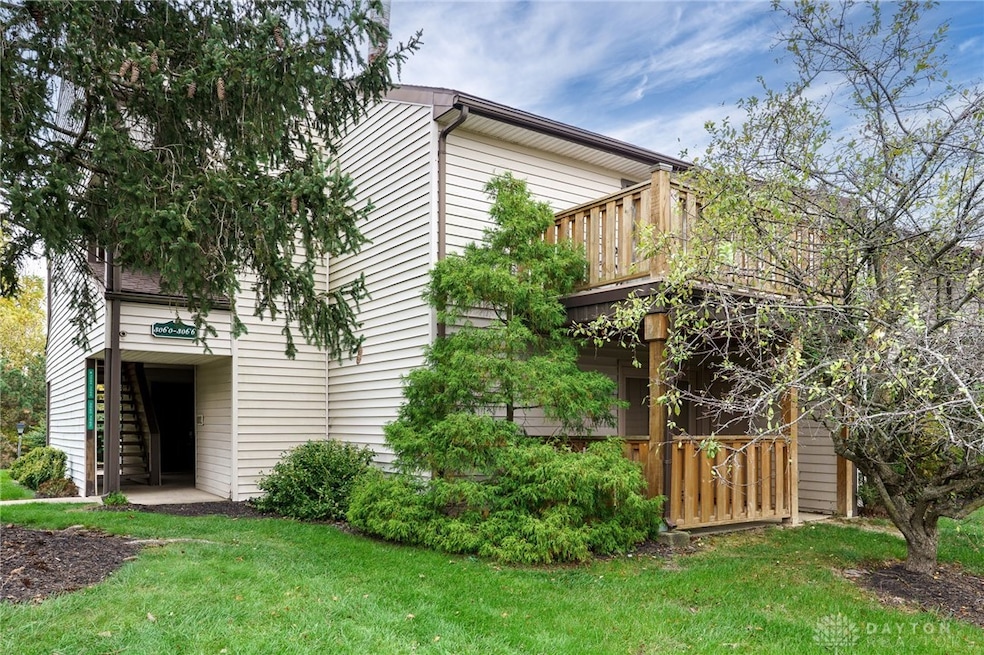
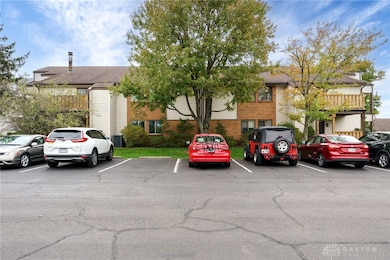
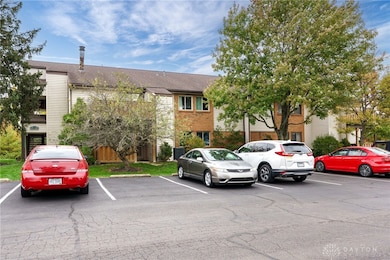
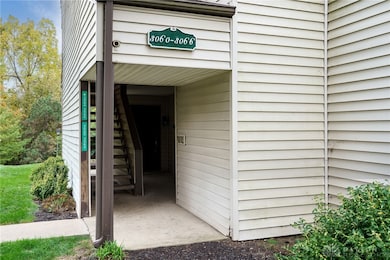
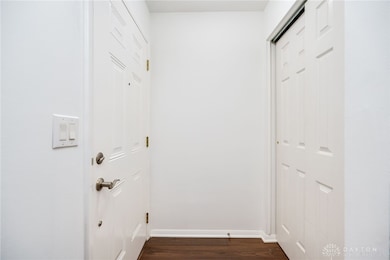
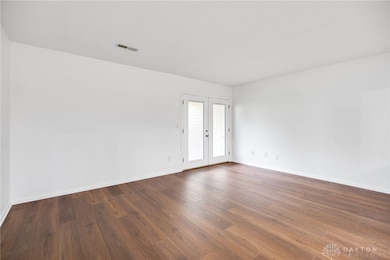
Come check out this first floor condo with BRAND NEW LPV flooring and all freshly painted through out! Being on the first floor there are no steps and is easily handicap accessible! Inside you will love the spacious living room that leads out to a darling patio with a nice size storage shed that was also just painted! The kitchen offers nice oak cabinets and is open to the dining room and the living room from where the wall has been opened up allowing great natural sunlight into the kitchen while you're cooking/entertaining! The Master bedroom offers a nice walk in closet and its own nice size master bathroom! The location is fantastic and close to anything you can possibly think of! Easy access to I-75 north and south, St. RT. 741, Cox Arboretum, Movie theater, shopping, shopping and more shopping! Restaurants galore and so much more! This is move in ready and you can be here and celebrate the holidays here!
Listing Agent
Agora Realty Group Brokerage Phone: (937) 520-9200 License #2005016357 Listed on: 10/31/2025
Property Details
Home Type
- Condominium
Year Built
- 1973
HOA Fees
- $350 Monthly HOA Fees
Parking
- No Garage
Home Design
- Slab Foundation
- Cedar
Interior Spaces
- 1,179 Sq Ft Home
- 1-Story Property
Kitchen
- Range
- Microwave
- Dishwasher
Bedrooms and Bathrooms
- 2 Bedrooms
- Bathroom on Main Level
- 2 Full Bathrooms
Outdoor Features
- Patio
Utilities
- Central Air
- Heating System Uses Natural Gas
Community Details
- Association fees include management, playground, pool(s), water
- Habitat Condo Subdivision
Listing and Financial Details
- Assessor Parcel Number K45-50001-0003
Map
Home Values in the Area
Average Home Value in this Area
Tax History
| Year | Tax Paid | Tax Assessment Tax Assessment Total Assessment is a certain percentage of the fair market value that is determined by local assessors to be the total taxable value of land and additions on the property. | Land | Improvement |
|---|---|---|---|---|
| 2024 | $1,974 | $27,540 | $5,510 | $22,030 |
| 2023 | $1,974 | $27,540 | $5,510 | $22,030 |
| 2022 | $1,425 | $16,790 | $3,360 | $13,430 |
| 2021 | $1,348 | $16,790 | $3,360 | $13,430 |
| 2020 | $1,387 | $17,560 | $3,360 | $14,200 |
| 2019 | $1,239 | $14,180 | $2,240 | $11,940 |
| 2018 | $1,231 | $14,180 | $2,240 | $11,940 |
| 2017 | $1,224 | $14,180 | $2,240 | $11,940 |
| 2016 | $1,115 | $12,360 | $2,240 | $10,120 |
| 2015 | $1,097 | $12,360 | $2,240 | $10,120 |
| 2014 | $1,097 | $12,360 | $2,240 | $10,120 |
| 2012 | -- | $17,480 | $4,200 | $13,280 |
Property History
| Date | Event | Price | List to Sale | Price per Sq Ft |
|---|---|---|---|---|
| 10/31/2025 10/31/25 | For Sale | $129,900 | -- | $110 / Sq Ft |
Purchase History
| Date | Type | Sale Price | Title Company |
|---|---|---|---|
| Warranty Deed | -- | None Available | |
| Survivorship Deed | $36,550 | Lakeside Title & Escrow Agen | |
| Special Warranty Deed | -- | Attorney | |
| Quit Claim Deed | -- | -- | |
| Legal Action Court Order | $35,000 | -- | |
| Sheriffs Deed | $35,000 | -- | |
| Warranty Deed | $40,400 | -- |
Source: Dayton REALTORS®
MLS Number: 946917
APN: K45-50001-0003
Disclaimer: Certain information contained herein is derived from information provided by parties other than Homes.com. All information provided is deemed reliable, but is not guaranteed to be accurate and should be independently verified.
![]() The information is being provided by Dayton Area Board of Realtors MLS. Information deemed reliable but not guaranteed. Information is provided for the consumer's personal, non-commercial use, and may not be used for any purpose other than the identification of potential properties for purchase. Copyright 2025 Dayton Area Board of Realtors MLS. All Rights Reserved.
The information is being provided by Dayton Area Board of Realtors MLS. Information deemed reliable but not guaranteed. Information is provided for the consumer's personal, non-commercial use, and may not be used for any purpose other than the identification of potential properties for purchase. Copyright 2025 Dayton Area Board of Realtors MLS. All Rights Reserved.
- 3074 Bright Bounty Ln Unit 38
- 3056 Bright Bounty Ln Unit 220
- 3034 Bright Bounty Ln Unit 29
- 3254 Gambit Square Unit 451
- 6433 Interlude Ln Unit 438
- 3304 Ultimate Way Unit 399
- 3316 Vanquil Trail Unit 387
- 6484 Quintessa Ct Unit 29
- 3324 Ultimate Way Unit 36
- Yeats Plan at Chamberlin Crossing
- Turnbull Plan at Chamberlin Crossing
- Remington Plan at Chamberlin Crossing
- Salinger Plan at Chamberlin Crossing
- Sinclair Plan at Chamberlin Crossing
- Steinbeck Plan at Chamberlin Crossing
- 3032 Wellington Ln
- Emerson Plan at Chamberlin Crossing
- Thoreau Plan at Chamberlin Crossing
- 3052 Simpson Ct
- 3052 Simpson Ct Unit 8337
- 3787 Summit Glen Dr
- 3067 Umberoak Dr
- 2050 Sidneywood Dr
- 1651 S Elm St
- 7851 Lois Cir
- 7477 Shady Water Ln
- 2824 Pinegrove Dr
- 841 Gawain Cir
- 7630 Mad River Rd
- 155 Prestige Place
- 1336 Camp Hill Way
- 7967 Washington Park Dr
- 8310 Lyons Gate Way
- 1735 Mars Hill Dr
- 8470 Towson Blvd
- 1644 Villa South Dr Unit 54
- 2650 Loris Dr
- 8500 Tree Top Ct
- 2125 Maue Rd
- 3031 Orchard Glen Dr
