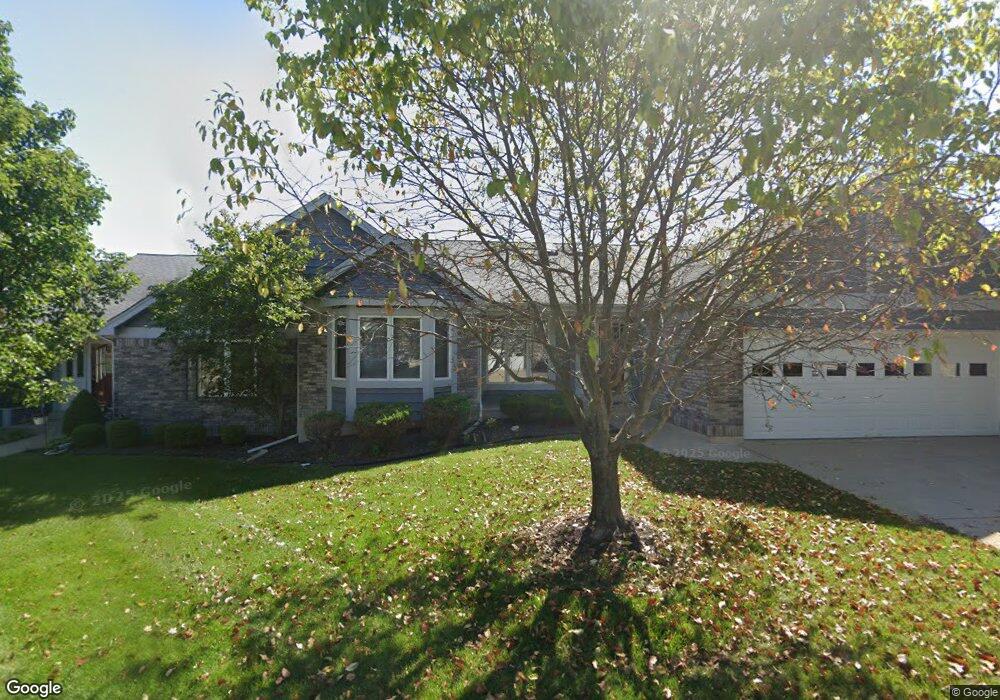
3060 Devilla Trail Saint Charles, MO 63301
Old Town Saint Charles NeighborhoodEstimated Value: $312,000 - $391,525
2
Beds
3
Baths
1,802
Sq Ft
$202/Sq Ft
Est. Value
About This Home
This home is located at 3060 Devilla Trail, Saint Charles, MO 63301 and is currently estimated at $364,131, approximately $202 per square foot. 3060 Devilla Trail is a home located in St. Charles County with nearby schools including Discovery Elementary School, Orchard Farm Elementary School, and Orchard Farm Middle School.
Ownership History
Date
Name
Owned For
Owner Type
Purchase Details
Closed on
Nov 15, 2021
Sold by
Bumb David M and Bumb Karen Ann
Bought by
Keller Jack E and Keller Catherine C
Current Estimated Value
Home Financials for this Owner
Home Financials are based on the most recent Mortgage that was taken out on this home.
Original Mortgage
$280,000
Outstanding Balance
$256,032
Interest Rate
2.99%
Mortgage Type
New Conventional
Estimated Equity
$108,099
Purchase Details
Closed on
Mar 6, 2015
Sold by
Bumb Carol J and Carol J Bumb Revocable Trust
Bought by
Bumb Clarence L and Bumb Carol J
Purchase Details
Closed on
Jan 22, 2002
Sold by
Bumb Clarence L and Bumb Carol J
Bought by
Bumb Carol J and Carol J Bumb Revocable Trust
Create a Home Valuation Report for This Property
The Home Valuation Report is an in-depth analysis detailing your home's value as well as a comparison with similar homes in the area
Home Values in the Area
Average Home Value in this Area
Purchase History
| Date | Buyer | Sale Price | Title Company |
|---|---|---|---|
| Keller Jack E | -- | Ust | |
| Bumb Clarence L | -- | None Available | |
| Bumb Carol J | -- | -- |
Source: Public Records
Mortgage History
| Date | Status | Borrower | Loan Amount |
|---|---|---|---|
| Open | Keller Jack E | $280,000 |
Source: Public Records
Tax History
| Year | Tax Paid | Tax Assessment Tax Assessment Total Assessment is a certain percentage of the fair market value that is determined by local assessors to be the total taxable value of land and additions on the property. | Land | Improvement |
|---|---|---|---|---|
| 2025 | $4,559 | $67,777 | -- | -- |
| 2023 | $4,561 | $67,979 | $0 | $0 |
| 2022 | $3,924 | $56,350 | $0 | $0 |
| 2021 | $3,559 | $56,350 | $0 | $0 |
| 2020 | $3,330 | $47,243 | $0 | $0 |
| 2019 | $3,017 | $47,243 | $0 | $0 |
| 2018 | $2,992 | $44,780 | $0 | $0 |
| 2017 | $2,946 | $44,780 | $0 | $0 |
| 2016 | $3,144 | $46,586 | $0 | $0 |
| 2015 | $3,169 | $46,586 | $0 | $0 |
| 2014 | $3,727 | $53,673 | $0 | $0 |
Source: Public Records
Map
Nearby Homes
- 3055 Devilla Trail Unit 8B
- 1516 Huncker Dr
- 728 Clarence Dr
- 3181 Cog Wheel Station
- 3291 River Breeze Ct
- 332 Crestfield Ct
- 3513 Brookside Crossing Dr
- 3238 Chester Blvd
- 3312 Charlestowne Crossing Dr
- 3243 Chester Blvd
- 3136 Bentwater Place
- 3249 River Breeze Ct
- 115 Palais Ct
- 3261 Simeon Bunker St
- 0 Unknown Unit MIS25074436
- 0 Unknown Unit MIS25074388
- 0 Unknown Unit MIS25074441
- 0 Unknown Unit MIS25074390
- 0 Unknown Unit MIS26008622
- 0 Unknown Unit MIS26008649
- 3060 Devilla Trail Unit 16B
- 3062 Devilla Trail
- 3054 Devilla Trail
- 3064 Devilla Trail
- 3065 Devilla Trail
- 3052 Devilla Trail
- 3063 Devilla Trail
- 3073 Devilla Trail
- 3073 Devilla Trail Unit 10A
- 3066 Devilla Trail
- 3075 Devilla Trail
- 3053 Devilla Trail
- 3053 Devilla Trail Unit 8A
- 3070 Devilla Trail
- 10 Delonta Trail
- 8 Depaula Trail
- 10 Depaula Trail
- 10 Depaula Trail Unit 18C
- 3055 Devilla Trail
- 6 Depaula Trail
Your Personal Tour Guide
Ask me questions while you tour the home.