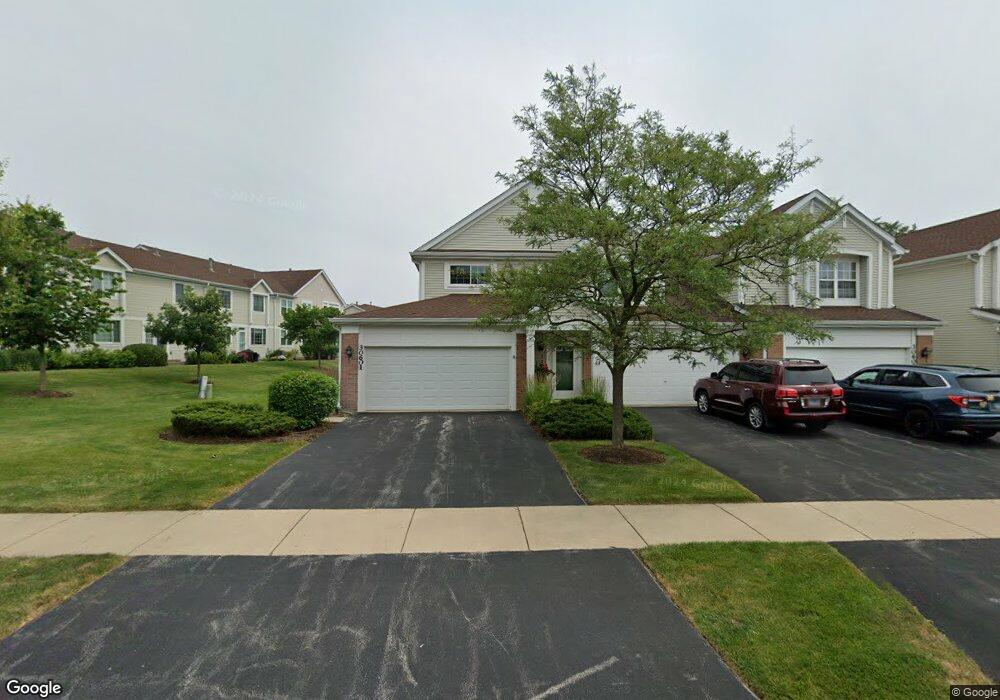
30601 Mccormick Ln Unit 107 Warrenville, IL 60555
Estimated Value: $348,000 - $368,000
2
Beds
2
Baths
1,408
Sq Ft
$254/Sq Ft
Est. Value
About This Home
This home is located at 30601 Mccormick Ln Unit 107, Warrenville, IL 60555 and is currently estimated at $357,941, approximately $254 per square foot. 30601 Mccormick Ln Unit 107 is a home located in DuPage County with nearby schools including Bower Elementary School, Hubble Middle School, and Wheaton Warrenville South High School.
Ownership History
Date
Name
Owned For
Owner Type
Purchase Details
Closed on
Aug 2, 2024
Sold by
Kaiser Sandra Jane
Bought by
Gregory Melissa
Current Estimated Value
Home Financials for this Owner
Home Financials are based on the most recent Mortgage that was taken out on this home.
Original Mortgage
$264,000
Outstanding Balance
$261,355
Interest Rate
7.5%
Mortgage Type
New Conventional
Estimated Equity
$96,586
Purchase Details
Closed on
Mar 8, 2016
Sold by
Borus Phyllis and Krolczyk Anita
Bought by
Kaiser Sidney and Kaiser Sandra Jane
Purchase Details
Closed on
Mar 11, 1998
Sold by
Dennis Barbara A
Bought by
Gill Helen G
Home Financials for this Owner
Home Financials are based on the most recent Mortgage that was taken out on this home.
Original Mortgage
$61,750
Interest Rate
7.14%
Mortgage Type
Purchase Money Mortgage
Create a Home Valuation Report for This Property
The Home Valuation Report is an in-depth analysis detailing your home's value as well as a comparison with similar homes in the area
Home Values in the Area
Average Home Value in this Area
Purchase History
| Date | Buyer | Sale Price | Title Company |
|---|---|---|---|
| Gregory Melissa | $330,000 | Chicago Title | |
| Kaiser Sidney | $190,000 | Fidelity National Title | |
| Gill Helen G | $65,500 | -- |
Source: Public Records
Mortgage History
| Date | Status | Borrower | Loan Amount |
|---|---|---|---|
| Open | Gregory Melissa | $264,000 | |
| Previous Owner | Gill Helen G | $61,750 |
Source: Public Records
Tax History Compared to Growth
Tax History
| Year | Tax Paid | Tax Assessment Tax Assessment Total Assessment is a certain percentage of the fair market value that is determined by local assessors to be the total taxable value of land and additions on the property. | Land | Improvement |
|---|---|---|---|---|
| 2024 | $3,702 | $98,344 | $11,431 | $86,913 |
| 2023 | $3,862 | $89,820 | $10,440 | $79,380 |
| 2022 | $4,278 | $83,920 | $9,740 | $74,180 |
| 2021 | $4,248 | $80,450 | $9,340 | $71,110 |
| 2020 | $4,277 | $78,010 | $9,060 | $68,950 |
| 2019 | $4,302 | $74,290 | $8,630 | $65,660 |
| 2018 | $4,584 | $72,160 | $8,390 | $63,770 |
| 2017 | $4,423 | $68,560 | $7,970 | $60,590 |
| 2016 | $4,468 | $63,920 | $7,430 | $56,490 |
| 2015 | $3,501 | $59,170 | $6,880 | $52,290 |
| 2014 | $3,570 | $56,350 | $6,550 | $49,800 |
| 2013 | $3,455 | $58,410 | $6,790 | $51,620 |
Source: Public Records
Map
Nearby Homes
- 31104 Carpenter Ct
- 31306 Kline Cir
- 27W680 Warrenville Rd
- 28W041 Greenview Ave
- 28W544 Rogers Ave
- 28W556 Forestview Dr
- 27 Wilbur Ave
- 28W686 Townline Rd
- 28W773 Stafford Place
- 3S281 Rockwell St
- 3S210 Herrick Rd
- 1209 W Bauer Rd
- 1109 W Bauer Rd
- 3S656 Landon Ave
- 1105 W Bauer Rd
- 1519 Wedgefield Cir
- 27W376 Hoy Rd
- 1432 Calcutta Ln
- 1518 Wedgefield Cir
- 3S389 Chestnut Ct
- 30601 Mccormick Ln Unit 30601
- 30604 Mccormick Ln
- 30605 Mccormick Ln
- 30504 Fowler Cir
- 30506 Fowler Cir
- 30505 Fowler Cir
- 30503 Fowler Cir
- 31001 Carpenter Ct
- 31001 Carpenter Ct Unit 3100
- 30502 Fowler Cir
- 30203 Fowler Cir
- 30204 Fowler Cir
- 30501 Fowler Cir
- 31002 Carpenter Ct
- 32405 Millard Cir
- 30701 Mccormick Ln
- 31003 Carpenter Ct
- 32403 Millard Cir
- 32401 Millard Cir
- 32401 Millard Cir Unit 401