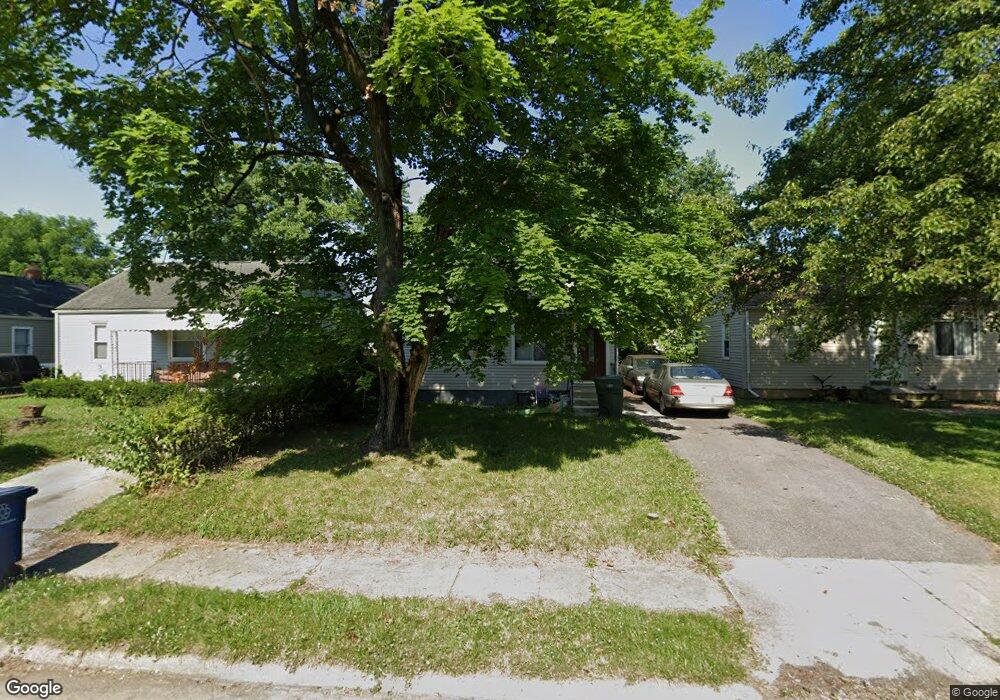
3061 Grasmere Ave Columbus, OH 43224
North Linden NeighborhoodEstimated Value: $99,000 - $122,336
2
Beds
1
Bath
672
Sq Ft
$166/Sq Ft
Est. Value
About This Home
This home is located at 3061 Grasmere Ave, Columbus, OH 43224 and is currently estimated at $111,584, approximately $166 per square foot. 3061 Grasmere Ave is a home located in Franklin County with nearby schools including Como Elementary School, Dominion Middle School, and Whetstone High School.
Ownership History
Date
Name
Owned For
Owner Type
Purchase Details
Closed on
Aug 15, 2025
Sold by
Martin Sarah L and Pomante Sarah L
Bought by
Tnr Equities Llc
Current Estimated Value
Purchase Details
Closed on
Feb 3, 2020
Sold by
Aloha Properties Llc
Bought by
Pomante Sarah L
Purchase Details
Closed on
Aug 26, 2016
Sold by
Rei Properties
Bought by
Aloha Properties Llc
Purchase Details
Closed on
Aug 23, 2016
Sold by
Rei Properties
Bought by
Aloha Properties Llc
Purchase Details
Closed on
Sep 8, 2008
Sold by
Us Bank Na
Bought by
Rei Properties Llc
Home Financials for this Owner
Home Financials are based on the most recent Mortgage that was taken out on this home.
Original Mortgage
$37,400
Interest Rate
6.52%
Mortgage Type
Purchase Money Mortgage
Purchase Details
Closed on
Jun 3, 2008
Sold by
Grimmett Scott A and Case #07Cve10 14500
Bought by
Us Bank Na
Purchase Details
Closed on
Dec 20, 1991
Bought by
Grimmett Scott A
Purchase Details
Closed on
Jul 19, 1988
Purchase Details
Closed on
Apr 5, 1988
Create a Home Valuation Report for This Property
The Home Valuation Report is an in-depth analysis detailing your home's value as well as a comparison with similar homes in the area
Home Values in the Area
Average Home Value in this Area
Purchase History
| Date | Buyer | Sale Price | Title Company |
|---|---|---|---|
| Tnr Equities Llc | $110,000 | Northwest Select Title | |
| Pomante Sarah L | -- | None Available | |
| Aloha Properties Llc | -- | None Available | |
| Aloha Properties Llc | -- | None Available | |
| Rei Properties Llc | $20,000 | Landcastle | |
| Us Bank Na | $32,000 | None Available | |
| Grimmett Scott A | $49,900 | -- | |
| -- | $32,900 | -- | |
| -- | -- | -- |
Source: Public Records
Mortgage History
| Date | Status | Borrower | Loan Amount |
|---|---|---|---|
| Previous Owner | Rei Properties Llc | $37,400 |
Source: Public Records
Tax History
| Year | Tax Paid | Tax Assessment Tax Assessment Total Assessment is a certain percentage of the fair market value that is determined by local assessors to be the total taxable value of land and additions on the property. | Land | Improvement |
|---|---|---|---|---|
| 2025 | $2,864 | $41,830 | $11,660 | $30,170 |
| 2024 | $2,864 | $41,830 | $11,660 | $30,170 |
| 2023 | $1,893 | $41,825 | $11,655 | $30,170 |
| 2022 | $1,606 | $20,130 | $5,250 | $14,880 |
| 2021 | $1,168 | $20,130 | $5,250 | $14,880 |
| 2020 | $1,248 | $20,130 | $5,250 | $14,880 |
| 2019 | $1,099 | $16,040 | $4,380 | $11,660 |
| 2018 | $647 | $7,710 | $4,380 | $3,330 |
| 2017 | $1,218 | $16,910 | $4,380 | $12,530 |
| 2016 | $587 | $4,800 | $3,610 | $1,190 |
| 2015 | $655 | $8,410 | $3,610 | $4,800 |
| 2014 | $521 | $8,410 | $3,610 | $4,800 |
| 2013 | $307 | $8,400 | $3,605 | $4,795 |
Source: Public Records
Map
Nearby Homes
- 3081 Grasmere Ave
- 3147 Grasmere Ave
- 2950 Grasmere Ave
- 2897 Grasmere Ave
- 2888 Howey Rd
- 2874 Grasmere Ave
- 2872 Howey Rd
- 2916 Hamilton Ave
- 1303 Oakland Park Ave
- 978 E North Broadway St
- 3268 McGuffey Rd
- 964 E Weber Rd
- 3035 Audubon Rd
- 1120 Piedmont Rd
- 1311 E Weber Rd
- 3056 Medina Ave
- 816 Melrose Ave
- 3352 Karl Rd
- 3134 Medina Ave
- 2890 Medina Ave
- 3057 Grasmere Ave
- 3067 Grasmere Ave
- 3071 Grasmere Ave
- 3051 Grasmere Ave
- 3045 Grasmere Ave
- 3077 Grasmere Ave
- 3080 Howey Rd
- 3068 Howey Rd
- 3064 Howey Rd
- 3074 Howey Rd Unit 80
- 3074 Howey Rd
- 3078 Howey Rd
- 3058 Howey Rd
- 3076 Howey Rd
- 3060 Grasmere Ave
- 3090 Howey Rd
- 3056 Grasmere Ave
- 3088 Howey Rd
- 3066 Grasmere Ave
Your Personal Tour Guide
Ask me questions while you tour the home.