30611 N High Meadow Cir Magnolia, TX 77355
Estimated Value: $629,000 - $732,000
--
Bed
1
Bath
2,683
Sq Ft
$248/Sq Ft
Est. Value
About This Home
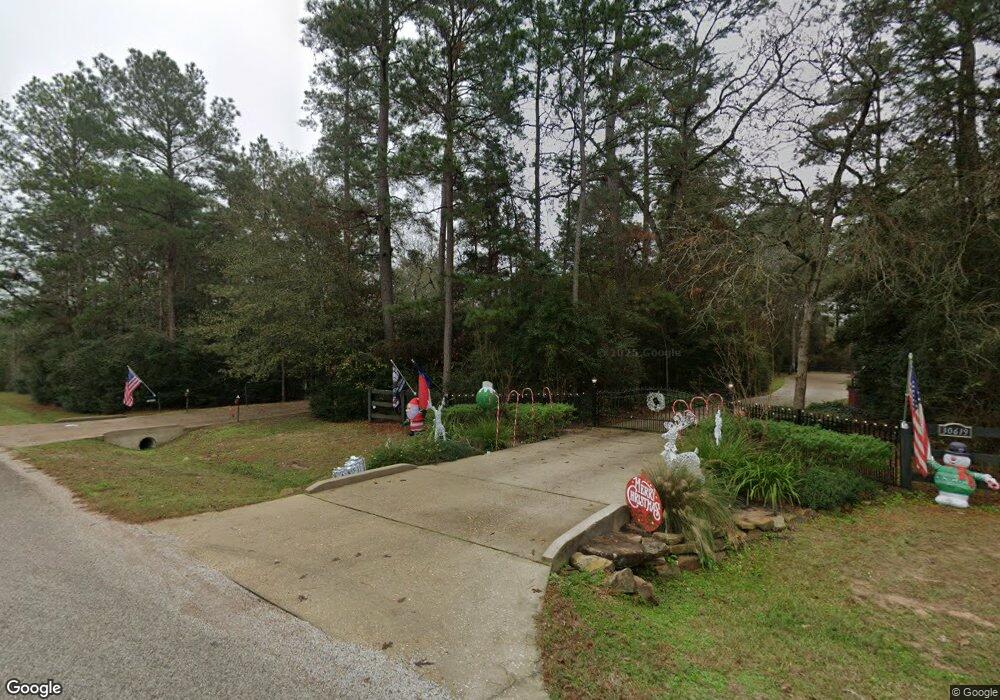
This home is located at 30611 N High Meadow Cir, Magnolia, TX 77355 and is currently estimated at $666,504, approximately $248 per square foot. 30611 N High Meadow Cir is a home located in Montgomery County with nearby schools including J.L. Lyon Elementary School, Magnolia Sixth Grade Campus, and Magnolia Junior High School.
Ownership History
Date
Name
Owned For
Owner Type
Purchase Details
Closed on
Oct 11, 2007
Sold by
Parsons Todd and Parsons Deanna
Bought by
Hummel Horst and Hummel Patricia
Current Estimated Value
Purchase Details
Closed on
Jun 2, 2005
Sold by
Roe Gary A
Bought by
Parsons Todd and Parsons Deanna
Home Financials for this Owner
Home Financials are based on the most recent Mortgage that was taken out on this home.
Original Mortgage
$34,015
Interest Rate
5.79%
Mortgage Type
Purchase Money Mortgage
Purchase Details
Closed on
Oct 26, 2004
Sold by
Woods Ray Michael and Woods Denise
Bought by
Roe Gary A
Home Financials for this Owner
Home Financials are based on the most recent Mortgage that was taken out on this home.
Original Mortgage
$25,600
Interest Rate
5.73%
Mortgage Type
Purchase Money Mortgage
Create a Home Valuation Report for This Property
The Home Valuation Report is an in-depth analysis detailing your home's value as well as a comparison with similar homes in the area
Home Values in the Area
Average Home Value in this Area
Purchase History
| Date | Buyer | Sale Price | Title Company |
|---|---|---|---|
| Hummel Horst | -- | Stewart Title Houston Div | |
| Parsons Todd | -- | Stewart Title | |
| Roe Gary A | -- | Stewart Title |
Source: Public Records
Mortgage History
| Date | Status | Borrower | Loan Amount |
|---|---|---|---|
| Previous Owner | Parsons Todd | $34,015 | |
| Previous Owner | Roe Gary A | $25,600 |
Source: Public Records
Tax History Compared to Growth
Tax History
| Year | Tax Paid | Tax Assessment Tax Assessment Total Assessment is a certain percentage of the fair market value that is determined by local assessors to be the total taxable value of land and additions on the property. | Land | Improvement |
|---|---|---|---|---|
| 2025 | $3,108 | $599,797 | -- | -- |
| 2024 | $3,064 | $545,270 | -- | -- |
| 2023 | $3,064 | $495,700 | $148,200 | $434,800 |
| 2022 | $7,952 | $450,640 | $148,530 | $424,120 |
| 2021 | $7,615 | $409,670 | $90,570 | $329,520 |
| 2020 | $7,537 | $372,430 | $90,570 | $281,860 |
| 2019 | $7,260 | $360,500 | $90,570 | $269,930 |
| 2018 | $5,865 | $331,680 | $61,750 | $269,930 |
| 2017 | $7,154 | $337,370 | $61,750 | $275,620 |
| 2016 | $6,747 | $318,180 | $61,750 | $256,430 |
| 2015 | $5,139 | $318,180 | $61,750 | $256,430 |
| 2014 | $5,139 | $290,880 | $25,730 | $265,150 |
Source: Public Records
Map
Nearby Homes
- 25103 Lake Park Ct
- 30311 N Holly Oaks Cir
- 25402 Holly Oaks Ct
- 30103 Thousand Oaks Ct
- 30003 Desert Willow Ct
- 22914 Bramblevine Dr
- Lot 152 Nottingham Cir
- 25319 Penguin St
- 22920 Blackgum Dr
- 20127 Sapphire Cir
- 22806 Lantana Dr
- 451 Pelican St
- 289 Pelican St
- 22922 Blackgum Dr
- 22710 Meadowsweet Dr
- 0 Baneberry
- 25091 Little John Cir
- 20002 Sapphire Cir
- 28126 Walnut Creek Ct
- 25137 Little John Cir
- 30603 N High Meadow Cir
- 30619 N High Meadow Cir
- 30610 N High Meadow Cir
- 30703 N High Meadow Cir
- 30702 N High Meadow Cir
- 30519 N High Meadow Cir
- 30618 N Holly Oaks Cir
- 30610 N Holly Oaks Cir
- 30614 N Holly Oaks Cir
- 30602 N High Meadow Cir
- 25088 Lake Park Ct
- 30510 N High Meadow Cir
- 30710 N High Meadow Cir
- Lot 74 N Holly Oaks Cir
- 30711 N High Meadow Cir
- 25302 Winding Creek Ct
- 30718 N High Meadow Cir
- 30611 N Holly Oaks Cir
- 30502 N High Meadow Cir
- 25180 Lake Park Ct