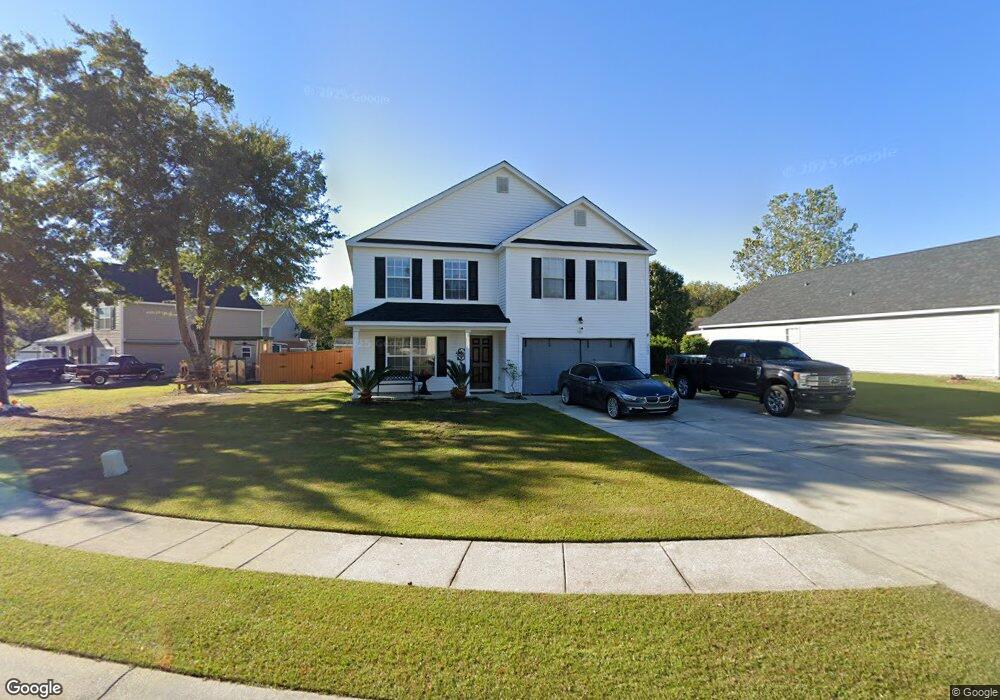
3062 Maple Leaf Dr Moncks Corner, SC 29461
Estimated Value: $339,000 - $363,415
4
Beds
3
Baths
2,621
Sq Ft
$134/Sq Ft
Est. Value
About This Home
This home is located at 3062 Maple Leaf Dr, Moncks Corner, SC 29461 and is currently estimated at $350,354, approximately $133 per square foot. 3062 Maple Leaf Dr is a home located in Berkeley County with nearby schools including Berkeley Elementary School, Berkeley Middle School, and Berkeley High School.
Ownership History
Date
Name
Owned For
Owner Type
Purchase Details
Closed on
Sep 28, 2007
Sold by
Benton David and 3062 Maple Leaf Trust
Bought by
Sims Ozra A and Sims Steven E
Current Estimated Value
Home Financials for this Owner
Home Financials are based on the most recent Mortgage that was taken out on this home.
Original Mortgage
$189,000
Outstanding Balance
$119,223
Interest Rate
6.41%
Mortgage Type
Purchase Money Mortgage
Estimated Equity
$231,131
Purchase Details
Closed on
Dec 14, 2005
Sold by
Wilson Ruth Denise and Wilson Hill Ruth Denise
Bought by
Benton David and 3062 Maple Leaf Trust
Purchase Details
Closed on
Nov 25, 2003
Sold by
Beazer Homes Corp
Bought by
Wilson Ruth Denise and Wilson Hill Ruth Denise
Purchase Details
Closed on
Nov 19, 2003
Sold by
M & W Investors Llc
Bought by
Beazer Homes Corp
Create a Home Valuation Report for This Property
The Home Valuation Report is an in-depth analysis detailing your home's value as well as a comparison with similar homes in the area
Purchase History
| Date | Buyer | Sale Price | Title Company |
|---|---|---|---|
| Sims Ozra A | $189,000 | None Available | |
| Benton David | -- | None Available | |
| Wilson Ruth Denise | $156,605 | -- | |
| Beazer Homes Corp | $440,000 | -- |
Source: Public Records
Mortgage History
| Date | Status | Borrower | Loan Amount |
|---|---|---|---|
| Open | Sims Ozra A | $189,000 |
Source: Public Records
Tax History
| Year | Tax Paid | Tax Assessment Tax Assessment Total Assessment is a certain percentage of the fair market value that is determined by local assessors to be the total taxable value of land and additions on the property. | Land | Improvement |
|---|---|---|---|---|
| 2025 | $1,635 | $225,619 | $48,416 | $177,203 |
| 2024 | $1,536 | $9,025 | $1,937 | $7,088 |
| 2023 | $1,536 | $9,025 | $1,937 | $7,088 |
| 2022 | $1,474 | $7,848 | $1,198 | $6,650 |
| 2021 | $1,412 | $7,850 | $1,198 | $6,650 |
| 2020 | $1,476 | $7,848 | $1,198 | $6,650 |
| 2019 | $1,458 | $7,848 | $1,198 | $6,650 |
| 2018 | $1,280 | $6,824 | $1,360 | $5,464 |
| 2017 | $1,266 | $6,700 | $1,360 | $5,340 |
| 2016 | $1,131 | $6,700 | $1,360 | $5,340 |
| 2015 | $977 | $6,700 | $1,360 | $5,340 |
| 2014 | $963 | $6,700 | $1,360 | $5,340 |
| 2013 | -- | $6,700 | $1,360 | $5,340 |
Source: Public Records
Map
Nearby Homes
- 2007 Robin Wood Blvd
- 100 Dellwood St
- 1420 U S 52
- 4012 Carolina Bay Dr
- 333 Bluebell Way
- 4004 Carolina Bay Dr
- 331 Bluebell Way
- 329 Bluebell Way
- 327 Bluebell Way
- 129 Yarrow Way
- 325 Bluebell Way
- 310 Bluebell Way
- 321 Bluebell Way
- 319 Bluebell Way
- 317 Bluebell Way
- 315 Bluebell Way
- 313 Bluebell Way
- 211 Blue Haw Dr
- 213 Blue Haw Dr
- 245 Blue Haw Dr
- 3064 Maple Leaf Dr
- 3054 Maple Leaf Dr
- 3038 Maple Leaf Dr
- 3038 Mapleleaf Dr
- 3066 Mapleleaf Dr
- 3066 Maple Leaf Dr
- 3036 Maple Leaf Dr
- 3036 Mapleleaf Dr
- 3057 Maple Leaf Dr
- 3063 Maple Leaf Dr
- 3059 Mapleleaf Dr
- 3059 Maple Leaf Dr
- 3034 Maple Leaf Dr
- 3061 Maple Leaf Dr
- 3040 Maple Leaf Dr
- 3065 Mapleleaf Dr
- 3065 Maple Leaf Dr
- 3068 Maple Leaf Dr
- 3055 Maple Leaf Dr
- 3032 Maple Leaf Dr
Your Personal Tour Guide
Ask me questions while you tour the home.