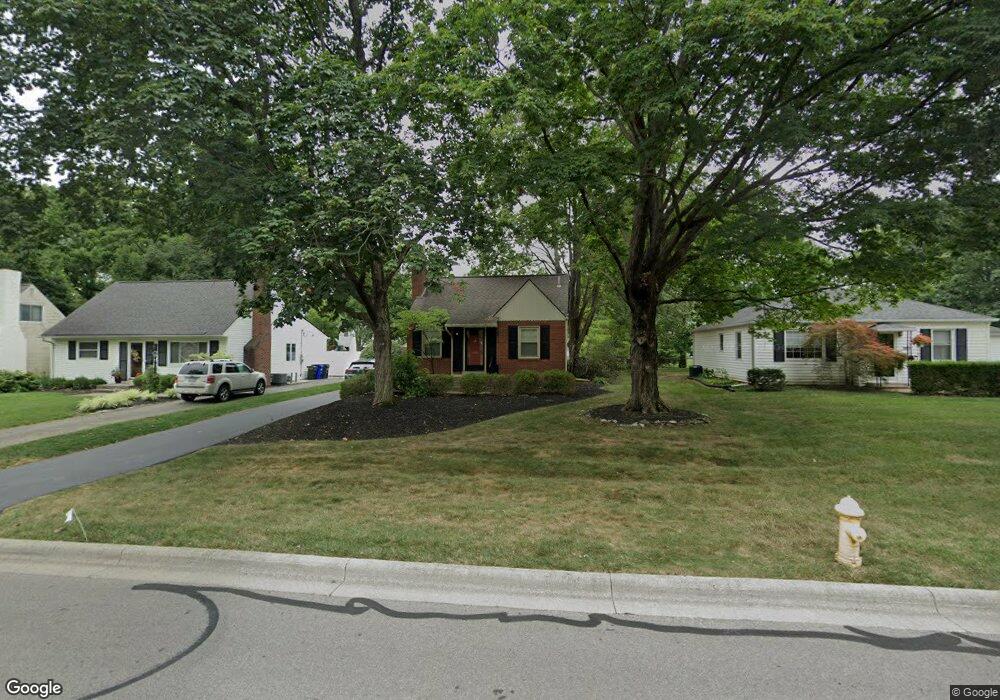
3063 Mountview Rd Columbus, OH 43221
Estimated Value: $357,888 - $425,000
3
Beds
1
Bath
1,066
Sq Ft
$364/Sq Ft
Est. Value
About This Home
This home is located at 3063 Mountview Rd, Columbus, OH 43221 and is currently estimated at $388,222, approximately $364 per square foot. 3063 Mountview Rd is a home located in Franklin County with nearby schools including Tremont Elementary School, Jones Middle School, and Upper Arlington High School.
Ownership History
Date
Name
Owned For
Owner Type
Purchase Details
Closed on
Nov 30, 2007
Sold by
Wiltshire Carly R and Wiltshire Philip T
Bought by
Holley Scott E
Current Estimated Value
Home Financials for this Owner
Home Financials are based on the most recent Mortgage that was taken out on this home.
Original Mortgage
$172,000
Outstanding Balance
$106,938
Interest Rate
6.31%
Mortgage Type
Purchase Money Mortgage
Estimated Equity
$281,284
Purchase Details
Closed on
Apr 30, 2004
Sold by
Miller Catherine H
Bought by
Skidmore Carly R
Home Financials for this Owner
Home Financials are based on the most recent Mortgage that was taken out on this home.
Original Mortgage
$145,600
Interest Rate
4.12%
Mortgage Type
Purchase Money Mortgage
Purchase Details
Closed on
May 11, 1987
Bought by
Miller Catherine H
Purchase Details
Closed on
Jun 1, 1984
Purchase Details
Closed on
Oct 1, 1980
Create a Home Valuation Report for This Property
The Home Valuation Report is an in-depth analysis detailing your home's value as well as a comparison with similar homes in the area
Home Values in the Area
Average Home Value in this Area
Purchase History
| Date | Buyer | Sale Price | Title Company |
|---|---|---|---|
| Holley Scott E | $172,000 | Talon Group | |
| Skidmore Carly R | $182,000 | -- | |
| Miller Catherine H | $69,500 | -- | |
| -- | $61,000 | -- | |
| -- | $62,000 | -- |
Source: Public Records
Mortgage History
| Date | Status | Borrower | Loan Amount |
|---|---|---|---|
| Open | Holley Scott E | $172,000 | |
| Previous Owner | Skidmore Carly R | $145,600 |
Source: Public Records
Tax History
| Year | Tax Paid | Tax Assessment Tax Assessment Total Assessment is a certain percentage of the fair market value that is determined by local assessors to be the total taxable value of land and additions on the property. | Land | Improvement |
|---|---|---|---|---|
| 2025 | $5,795 | $100,100 | $45,360 | $54,740 |
| 2024 | $5,795 | $100,100 | $45,360 | $54,740 |
| 2023 | $5,723 | $100,100 | $45,360 | $54,740 |
| 2022 | $5,234 | $74,900 | $33,390 | $41,510 |
| 2021 | $4,633 | $74,900 | $33,390 | $41,510 |
| 2020 | $4,592 | $74,900 | $33,390 | $41,510 |
| 2019 | $4,483 | $64,650 | $33,390 | $31,260 |
| 2018 | $4,220 | $64,650 | $33,390 | $31,260 |
| 2017 | $4,449 | $64,650 | $33,390 | $31,260 |
| 2016 | $3,985 | $60,270 | $26,250 | $34,020 |
| 2015 | $3,982 | $60,270 | $26,250 | $34,020 |
| 2014 | $3,986 | $60,270 | $26,250 | $34,020 |
| 2013 | $1,904 | $54,810 | $23,870 | $30,940 |
Source: Public Records
Map
Nearby Homes
- 2227 Zollinger Rd
- 3134 Asbury Dr
- 2979 Avalon Rd
- 3194 Mountview Rd
- 2390 Zollinger Rd
- 2089 Jervis Rd
- 2257 Swansea Rd
- 3134 Herrick Rd
- 2375 Swansea Rd
- 3163 S Dorchester Rd
- 3106 Somerford Rd
- 1872 Kentwell Rd Unit 1872
- 2424 Nottingham Rd
- 2443 Shrewsbury Rd
- 1842 Ridgecliff Rd
- 2729 Eastcleft Dr
- 2528 Onandaga Dr
- 2480 Shrewsbury Rd
- 1744 Ridgecliff Rd Unit 12
- 1763-1769 Ardleigh Rd Unit 1763-1769
- 3071 Mountview Rd
- 3057 Mountview Rd
- 3047 Mountview Rd
- 3079 Mountview Rd
- 2230 Inchcliff Rd
- 3085 Mountview Rd
- 3041 Mountview Rd
- 2231 Inchcliff Rd
- 3032 Avalon Rd
- 3084 Mountview Rd
- 3093 Mountview Rd
- 3033 Mountview Rd
- 2220 Inchcliff Rd
- 3080 Avalon Rd
- 3050 Avalon Rd
- 3068 Avalon Rd
- 2223 Inchcliff Rd
- 3020 Avalon Rd
- 2215 Jervis Rd
- 3030 Mountview Rd
Your Personal Tour Guide
Ask me questions while you tour the home.