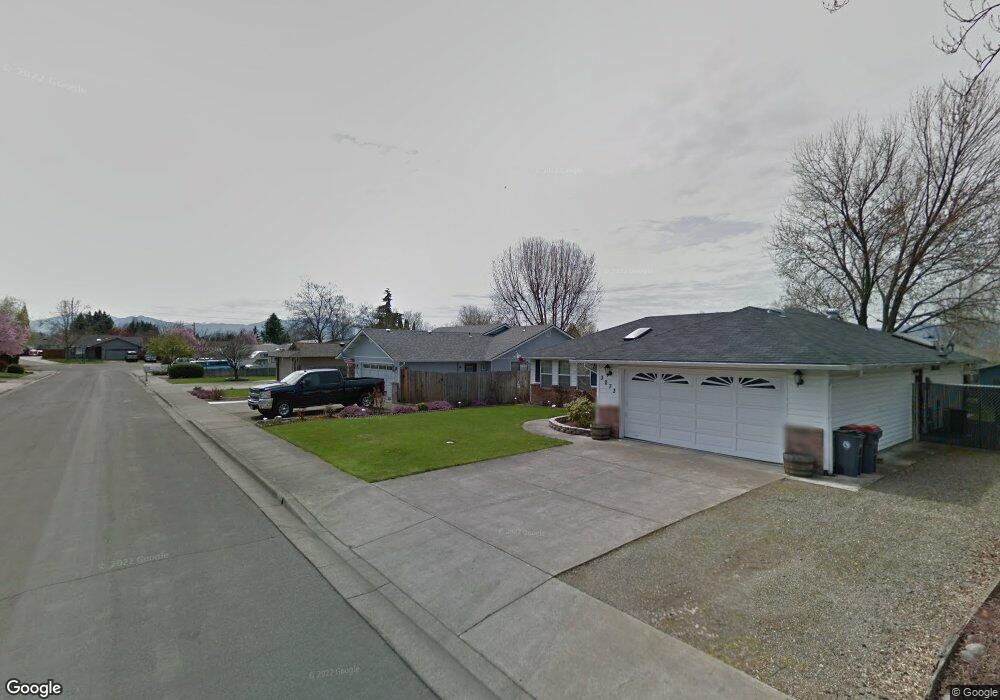
3063 Nettie Way Medford, OR 97504
Estimated Value: $379,000 - $413,000
3
Beds
2
Baths
1,486
Sq Ft
$263/Sq Ft
Est. Value
About This Home
This home is located at 3063 Nettie Way, Medford, OR 97504 and is currently estimated at $391,162, approximately $263 per square foot. 3063 Nettie Way is a home located in Jackson County with nearby schools including Abraham Lincoln Elementary School, Hedrick Middle School, and North Medford High School.
Ownership History
Date
Name
Owned For
Owner Type
Purchase Details
Closed on
Apr 23, 2021
Sold by
Sannar Bonnie L and Bonnie L Sannar Living Trust
Bought by
Sannar Bonnie L
Current Estimated Value
Home Financials for this Owner
Home Financials are based on the most recent Mortgage that was taken out on this home.
Original Mortgage
$168,000
Outstanding Balance
$151,684
Interest Rate
3%
Mortgage Type
New Conventional
Estimated Equity
$239,478
Purchase Details
Closed on
Jul 16, 2009
Sold by
Sannar Bonnie L
Bought by
Sannar Bonnie L and The Bonnie L Sannar Living Trust
Purchase Details
Closed on
Aug 8, 2007
Sold by
Malone Donald C
Bought by
Sannar Bonnie L
Home Financials for this Owner
Home Financials are based on the most recent Mortgage that was taken out on this home.
Original Mortgage
$130,000
Interest Rate
6.65%
Mortgage Type
Purchase Money Mortgage
Purchase Details
Closed on
May 17, 1999
Sold by
Strader Paul A and Strader Vicki L
Bought by
Malone Donald C and Malone Bonnie I
Create a Home Valuation Report for This Property
The Home Valuation Report is an in-depth analysis detailing your home's value as well as a comparison with similar homes in the area
Home Values in the Area
Average Home Value in this Area
Purchase History
| Date | Buyer | Sale Price | Title Company |
|---|---|---|---|
| Sannar Bonnie L | -- | Ticor Title | |
| Sannar Bonnie L | -- | None Available | |
| Sannar Bonnie L | $255,000 | Amerititle | |
| Malone Donald C | $135,000 | Amerititle |
Source: Public Records
Mortgage History
| Date | Status | Borrower | Loan Amount |
|---|---|---|---|
| Open | Sannar Bonnie L | $168,000 | |
| Closed | Sannar Bonnie L | $130,000 |
Source: Public Records
Tax History Compared to Growth
Tax History
| Year | Tax Paid | Tax Assessment Tax Assessment Total Assessment is a certain percentage of the fair market value that is determined by local assessors to be the total taxable value of land and additions on the property. | Land | Improvement |
|---|---|---|---|---|
| 2025 | $3,188 | $219,840 | $84,150 | $135,690 |
| 2024 | $3,188 | $213,440 | $81,700 | $131,740 |
| 2023 | $3,091 | $207,230 | $79,320 | $127,910 |
| 2022 | $3,015 | $207,230 | $79,320 | $127,910 |
| 2021 | $2,937 | $201,200 | $77,010 | $124,190 |
| 2020 | $2,875 | $195,340 | $74,770 | $120,570 |
| 2019 | $2,807 | $184,140 | $70,470 | $113,670 |
| 2018 | $2,735 | $178,780 | $68,410 | $110,370 |
| 2017 | $2,686 | $178,780 | $68,410 | $110,370 |
| 2016 | $2,704 | $168,530 | $64,490 | $104,040 |
| 2015 | $2,599 | $168,530 | $64,490 | $104,040 |
| 2014 | $2,553 | $158,870 | $60,790 | $98,080 |
Source: Public Records
Map
Nearby Homes
- 3321 Oneida Cir
- 3093 Paul Cir
- 2995 Bedford Cir
- 3054 Levi Cir
- 3358 Viewpoint Dr
- 3362 Viewpoint Dr
- 2965 Bailey Ave
- 3050 Delta Waters Rd
- 3024 Adams Cir
- 3228 Garner Way
- 3718 Carlin Dr
- 3726 Carlin Dr
- 3727 Carlin Dr
- 3719 Carlin Dr
- 3739 Ford Dr
- 3747 Ford Dr
- 3691 Ford Dr
- 0 N Foothill Rd Unit 23941571
- 0 N Foothill Rd Unit 220203366
- 3473 Poppywoods Dr