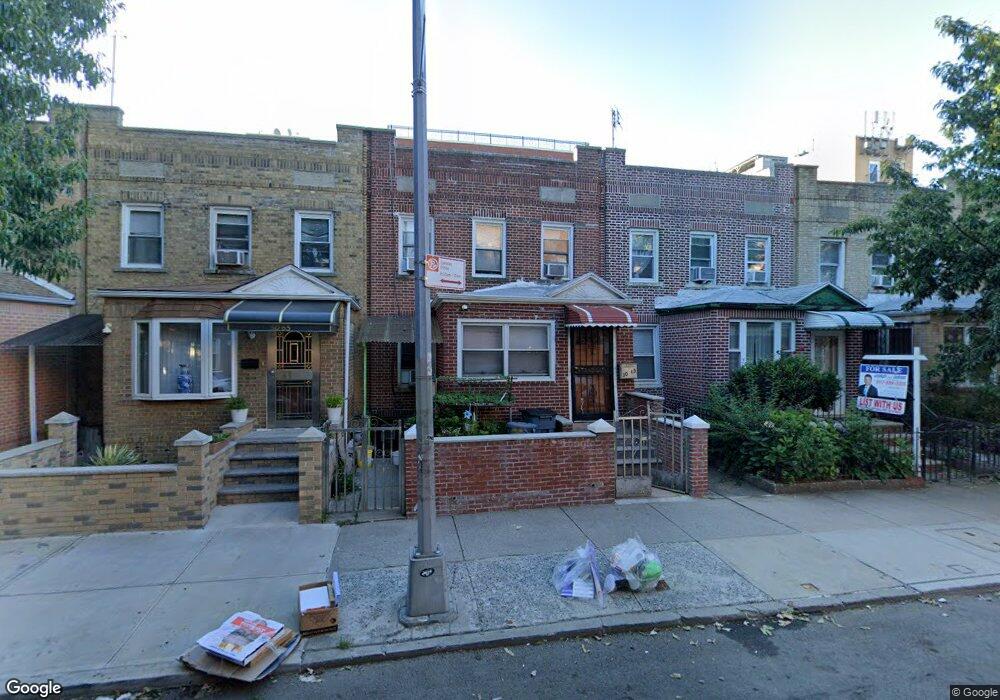
3065 37th St Astoria, NY 11103
Astoria NeighborhoodEstimated Value: $1,041,416 - $1,160,000
--
Bed
--
Bath
1,375
Sq Ft
$803/Sq Ft
Est. Value
About This Home
This home is located at 3065 37th St, Astoria, NY 11103 and is currently estimated at $1,103,854, approximately $802 per square foot. 3065 37th St is a home located in Queens County with nearby schools including I.S. 010 Horace Greeley, William Cullen Bryant High School, and Our World Neighborhood Charter School.
Ownership History
Date
Name
Owned For
Owner Type
Purchase Details
Closed on
Sep 22, 2022
Sold by
Hua Nam Thu and Jiang Jie Jun
Bought by
Jiang Jie Jun and Liao Fang
Current Estimated Value
Home Financials for this Owner
Home Financials are based on the most recent Mortgage that was taken out on this home.
Original Mortgage
$380,000
Outstanding Balance
$363,247
Interest Rate
5.66%
Mortgage Type
Purchase Money Mortgage
Estimated Equity
$740,607
Purchase Details
Closed on
Aug 6, 2008
Sold by
Jiang Jie Jun and Liao Fang
Bought by
Hua Nam Thu and Jiang Jie Jun
Purchase Details
Closed on
Feb 23, 1999
Sold by
Collins Gerald Francis and Collins Brendan
Bought by
Alam Mohammed and Alam Taslima
Home Financials for this Owner
Home Financials are based on the most recent Mortgage that was taken out on this home.
Original Mortgage
$173,250
Interest Rate
7.04%
Mortgage Type
Purchase Money Mortgage
Create a Home Valuation Report for This Property
The Home Valuation Report is an in-depth analysis detailing your home's value as well as a comparison with similar homes in the area
Home Values in the Area
Average Home Value in this Area
Purchase History
| Date | Buyer | Sale Price | Title Company |
|---|---|---|---|
| Jiang Jie Jun | -- | -- | |
| Jiang Jie Jun | -- | -- | |
| Hua Nam Thu | -- | -- | |
| Hua Nam Thu | -- | -- | |
| Alam Mohammed | $192,500 | First American Title Ins Co | |
| Alam Mohammed | $192,500 | First American Title Ins Co |
Source: Public Records
Mortgage History
| Date | Status | Borrower | Loan Amount |
|---|---|---|---|
| Open | Jiang Jie Jun | $380,000 | |
| Closed | Jiang Jie Jun | $380,000 | |
| Previous Owner | Alam Mohammed | $173,250 | |
| Closed | Hua Nam Thu | $0 |
Source: Public Records
Tax History Compared to Growth
Tax History
| Year | Tax Paid | Tax Assessment Tax Assessment Total Assessment is a certain percentage of the fair market value that is determined by local assessors to be the total taxable value of land and additions on the property. | Land | Improvement |
|---|---|---|---|---|
| 2025 | $7,254 | $38,263 | $5,833 | $32,430 |
| 2024 | $7,254 | $36,116 | $5,172 | $30,944 |
| 2023 | $6,908 | $34,396 | $5,257 | $29,139 |
| 2022 | $6,866 | $72,180 | $10,500 | $61,680 |
| 2021 | $7,110 | $67,500 | $10,500 | $57,000 |
| 2020 | $6,749 | $62,460 | $10,500 | $51,960 |
| 2019 | $6,296 | $61,620 | $10,500 | $51,120 |
| 2018 | $5,843 | $28,663 | $4,373 | $24,290 |
| 2017 | $5,843 | $28,663 | $6,000 | $22,663 |
| 2016 | $5,628 | $28,663 | $6,000 | $22,663 |
| 2015 | $3,042 | $26,572 | $6,892 | $19,680 |
| 2014 | $3,042 | $25,081 | $7,798 | $17,283 |
Source: Public Records
Map
Nearby Homes
- 30-71 37th St
- 3702 31st Ave
- 3145 37th St Unit 3
- 30-63 32nd St Unit 3B
- 31-42 34th St Unit MultiFamily
- 31-20 41st St
- 31-49 33rd St
- 30-24 32nd St Unit 2-B
- 30-24 32nd St Unit 3A
- 30-24 32nd St Unit 3B
- 30-24 32nd St Unit 4A
- 30-24 32nd St Unit 2-A
- 30-77 42nd St
- 3063 31st St Unit 702
- 31-74 33rd St
- 31-35 31st St
- 2590 37th St
- 31-71 32nd St
- 25 W 28th St Unit PH 42 B
- 25 W 28th St Unit 41D