3065 Pavo Real Ave Unit 5 Sparks, NV 89436
Wingfield Springs NeighborhoodEstimated Value: $549,252 - $569,000
3
Beds
2
Baths
1,852
Sq Ft
$300/Sq Ft
Est. Value
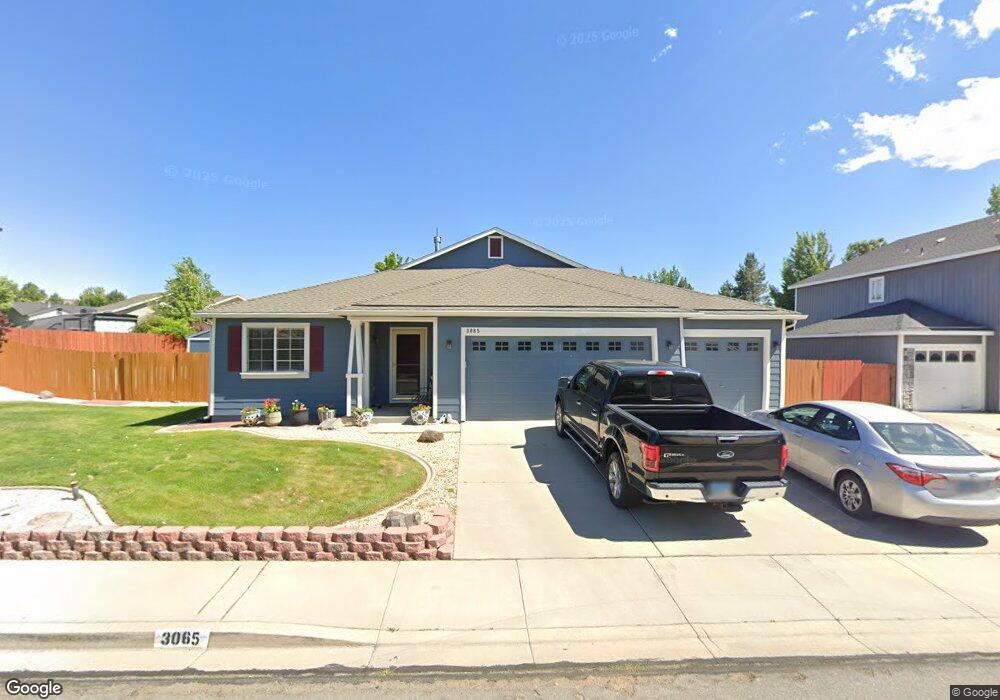
About This Home
This home is located at 3065 Pavo Real Ave Unit 5, Sparks, NV 89436 and is currently estimated at $556,063, approximately $300 per square foot. 3065 Pavo Real Ave Unit 5 is a home located in Washoe County with nearby schools including Southern Elementary School, Van Gorder Elementary School, and Sky Ranch Middle School.
Ownership History
Date
Name
Owned For
Owner Type
Purchase Details
Closed on
Mar 30, 2023
Sold by
Ballentine Linde D
Bought by
Ballentine Living Trust
Current Estimated Value
Purchase Details
Closed on
Mar 8, 2011
Sold by
Brooks Steven E and Brooks Ashley E
Bought by
Ballentine Linde D and Beck Virginia L
Home Financials for this Owner
Home Financials are based on the most recent Mortgage that was taken out on this home.
Original Mortgage
$175,339
Interest Rate
4.75%
Mortgage Type
FHA
Purchase Details
Closed on
Sep 14, 2006
Sold by
Malloy Gary A and Malloy Carol A
Bought by
Brooks Steven E and Brooks Ashley E
Home Financials for this Owner
Home Financials are based on the most recent Mortgage that was taken out on this home.
Original Mortgage
$270,800
Interest Rate
6.43%
Mortgage Type
Purchase Money Mortgage
Purchase Details
Closed on
Jun 14, 1999
Sold by
Centex Homes
Bought by
Malloy Gary A and Malloy Carol A
Create a Home Valuation Report for This Property
The Home Valuation Report is an in-depth analysis detailing your home's value as well as a comparison with similar homes in the area
Home Values in the Area
Average Home Value in this Area
Purchase History
| Date | Buyer | Sale Price | Title Company |
|---|---|---|---|
| Ballentine Living Trust | -- | -- | |
| Ballentine Linde D | $180,000 | Ticor Title Reno | |
| Brooks Steven E | $339,000 | First Centennial Title Co | |
| Malloy Gary A | $168,000 | First Centennial Title Co |
Source: Public Records
Mortgage History
| Date | Status | Borrower | Loan Amount |
|---|---|---|---|
| Previous Owner | Ballentine Linde D | $175,339 | |
| Previous Owner | Brooks Steven E | $270,800 |
Source: Public Records
Tax History Compared to Growth
Tax History
| Year | Tax Paid | Tax Assessment Tax Assessment Total Assessment is a certain percentage of the fair market value that is determined by local assessors to be the total taxable value of land and additions on the property. | Land | Improvement |
|---|---|---|---|---|
| 2026 | $2,123 | $113,329 | $41,125 | $72,204 |
| 2025 | $2,759 | $110,424 | $36,855 | $73,569 |
| 2024 | $2,759 | $106,552 | $32,200 | $74,352 |
| 2023 | $2,680 | $107,124 | $36,750 | $70,374 |
| 2022 | $2,602 | $87,157 | $28,490 | $58,667 |
| 2021 | $2,527 | $81,475 | $22,995 | $58,480 |
| 2020 | $2,451 | $82,297 | $23,625 | $58,672 |
| 2019 | $2,380 | $78,685 | $21,875 | $56,810 |
| 2018 | $2,312 | $71,461 | $15,785 | $55,676 |
| 2017 | $2,244 | $71,198 | $15,365 | $55,833 |
| 2016 | $2,187 | $70,730 | $13,685 | $57,045 |
| 2015 | $2,183 | $71,132 | $13,405 | $57,727 |
| 2014 | -- | $65,994 | $10,430 | $55,564 |
| 2013 | -- | $53,780 | $8,155 | $45,625 |
Source: Public Records
Map
Nearby Homes
- 3245 Gerona Ct
- 7766 Corneta Ct
- 7778 Cerritos Cir Unit 7
- 7842 Alcandre Ct
- 7718 Rhythm Cir
- 7366 Grand Island Dr
- 7311 S Florentine Dr Unit 10A
- 3149 Gladiola Ct
- 7859 Guerra Ct
- 7464 Europa Dr
- 7483 Europa Dr
- 3716 Early Dawn Dr
- 3461 Tavira Ct
- 7850 Morro Ave
- 7240 Silver King Dr
- 8495 Eaglenest Rd
- 7423 Comet Ct
- 7260 Treeline Ct
- 7315 Silver King Dr
- 8570 Eaglenest Rd
- 3055 Pavo Real Ave Unit 5
- 3082 Bandera Ave
- 3090 Bandera Ave
- 3070 Bandera Ave
- 3045 Pavo Real Ave Unit 5
- 3062 Bandera Ave
- 7710 Gato Ct
- 7705 Lobo Ct
- 3050 Bandera Ave
- 7455 Gato Ct
- 3038 Bandera Ave
- 7725 Lobo Ct
- 7720 Gato Ct
- 3025 Pavo Real Ave
- 3030 Bandera Ave
- 3081 Bandera Ave
- 3067 Bandera Ave
- 3095 Bandera Ave
- 3075 Bandera Ave
- 3024 Bandera Ave