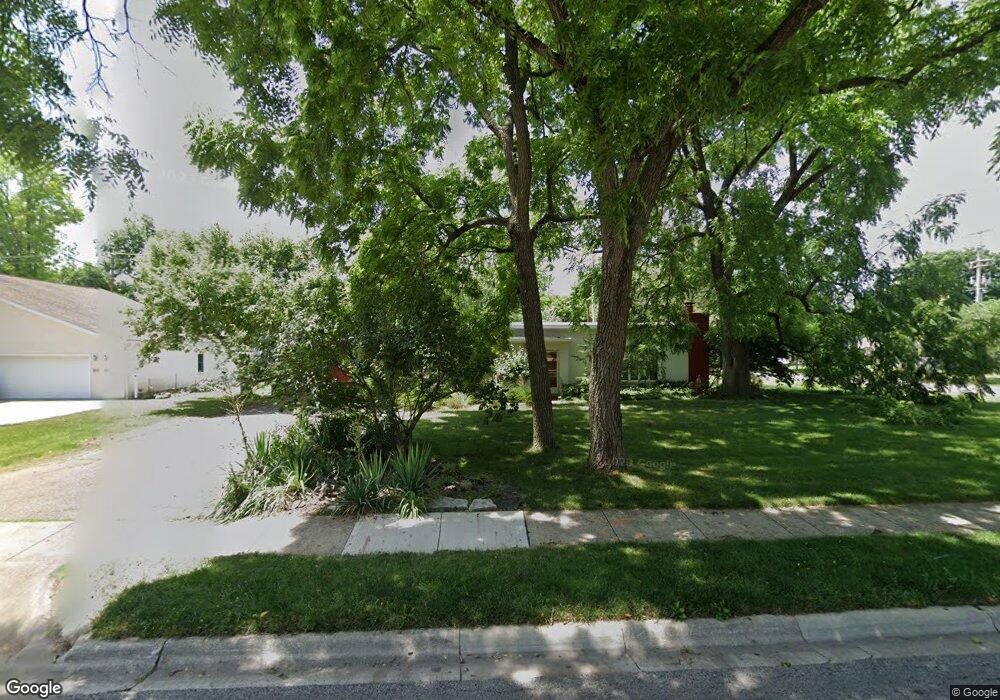
3065 Redding Rd Columbus, OH 43221
Estimated Value: $538,000 - $1,211,000
3
Beds
2
Baths
1,480
Sq Ft
$662/Sq Ft
Est. Value
About This Home
This home is located at 3065 Redding Rd, Columbus, OH 43221 and is currently estimated at $980,064, approximately $662 per square foot. 3065 Redding Rd is a home located in Franklin County with nearby schools including Tremont Elementary School, Jones Middle School, and Upper Arlington High School.
Ownership History
Date
Name
Owned For
Owner Type
Purchase Details
Closed on
Nov 11, 2022
Sold by
Compass Homes Inc
Bought by
Vance Mark and Casas Susana Beceiro
Current Estimated Value
Home Financials for this Owner
Home Financials are based on the most recent Mortgage that was taken out on this home.
Original Mortgage
$1,132,250
Outstanding Balance
$1,082,849
Interest Rate
5.38%
Mortgage Type
New Conventional
Estimated Equity
-$102,785
Purchase Details
Closed on
Oct 25, 2022
Sold by
Compass Homes Inc
Bought by
Vance Mark and Casas Susana Beceiro
Home Financials for this Owner
Home Financials are based on the most recent Mortgage that was taken out on this home.
Original Mortgage
$1,132,250
Outstanding Balance
$1,082,849
Interest Rate
5.38%
Mortgage Type
New Conventional
Estimated Equity
-$102,785
Purchase Details
Closed on
Apr 18, 2022
Sold by
Porto Robert J
Bought by
Compass Homes Inc
Purchase Details
Closed on
Jun 27, 2002
Sold by
Nitschke Donna L
Bought by
Porto Robert J
Home Financials for this Owner
Home Financials are based on the most recent Mortgage that was taken out on this home.
Original Mortgage
$136,500
Interest Rate
6.82%
Mortgage Type
Purchase Money Mortgage
Purchase Details
Closed on
Nov 8, 1991
Bought by
Nitschke Donna L
Purchase Details
Closed on
Jul 27, 1987
Create a Home Valuation Report for This Property
The Home Valuation Report is an in-depth analysis detailing your home's value as well as a comparison with similar homes in the area
Home Values in the Area
Average Home Value in this Area
Purchase History
| Date | Buyer | Sale Price | Title Company |
|---|---|---|---|
| Vance Mark | $415,000 | Stewart Title | |
| Vance Mark | $415,000 | Stewart Title | |
| Compass Homes Inc | $400,000 | Stewart Title | |
| Porto Robert J | $195,000 | Chicago Title | |
| Nitschke Donna L | $106,000 | -- | |
| -- | -- | -- |
Source: Public Records
Mortgage History
| Date | Status | Borrower | Loan Amount |
|---|---|---|---|
| Open | Vance Mark | $1,132,250 | |
| Closed | Vance Mark | $1,132,250 | |
| Previous Owner | Porto Robert J | $136,500 |
Source: Public Records
Tax History Compared to Growth
Tax History
| Year | Tax Paid | Tax Assessment Tax Assessment Total Assessment is a certain percentage of the fair market value that is determined by local assessors to be the total taxable value of land and additions on the property. | Land | Improvement |
|---|---|---|---|---|
| 2024 | $20,943 | $352,350 | $66,990 | $285,360 |
| 2023 | $8,468 | $144,800 | $66,990 | $77,810 |
| 2022 | $12,944 | $125,830 | $66,610 | $59,220 |
| 2021 | $7,960 | $125,830 | $66,610 | $59,220 |
| 2020 | $7,891 | $125,830 | $66,610 | $59,220 |
| 2019 | $7,953 | $111,900 | $66,610 | $45,290 |
| 2018 | $6,742 | $111,900 | $66,610 | $45,290 |
| 2017 | $6,687 | $111,900 | $66,610 | $45,290 |
| 2016 | $5,493 | $80,890 | $39,240 | $41,650 |
| 2015 | $5,586 | $80,890 | $39,240 | $41,650 |
| 2014 | $5,494 | $80,890 | $39,240 | $41,650 |
| 2013 | $2,673 | $73,535 | $35,665 | $37,870 |
Source: Public Records
Map
Nearby Homes
- 2227 Zollinger Rd
- 2047 Langham Rd
- 3161 Avalon Rd
- 2979 Avalon Rd
- 2370 Zollinger Rd
- 3106 Somerford Rd
- 2225 Swansea Rd
- 2438 Sherwood Villa Unit 5
- 3296 Leighton Rd
- 1842 Ridgecliff Rd
- 3175 Tremont Rd Unit 504
- 3175 Tremont Rd Unit 313
- 3015 Welsford Rd
- 3163 S Dorchester Rd
- 3509 Redding Rd
- 1743 Ardleigh Rd Unit 1743
- 2583 Wexford Rd
- 2401 Shrewsbury Rd
- 2443 Shrewsbury Rd
- 3190 Kioka Ave
- 3051 Redding Rd
- 2170 Inchcliff Rd
- 2173 Jervis Rd
- 2154 Jervis Rd
- 3060 Redding Rd
- 2164 Jervis Rd
- 2180 Inchcliff Rd
- 2138 Inchcliff Rd
- 2181 Jervis Rd
- 2172 Jervis Rd
- 2188 Inchcliff Rd
- 2130 Jervis Rd
- 2121 Jervis Rd
- 2180 Jervis Rd
- 2189 Jervis Rd
- 2128 Inchcliff Rd
- 2161 Inchcliff Rd
- 3105 Redding Rd
- 2171 Inchcliff Rd
- 2161 Zollinger Rd