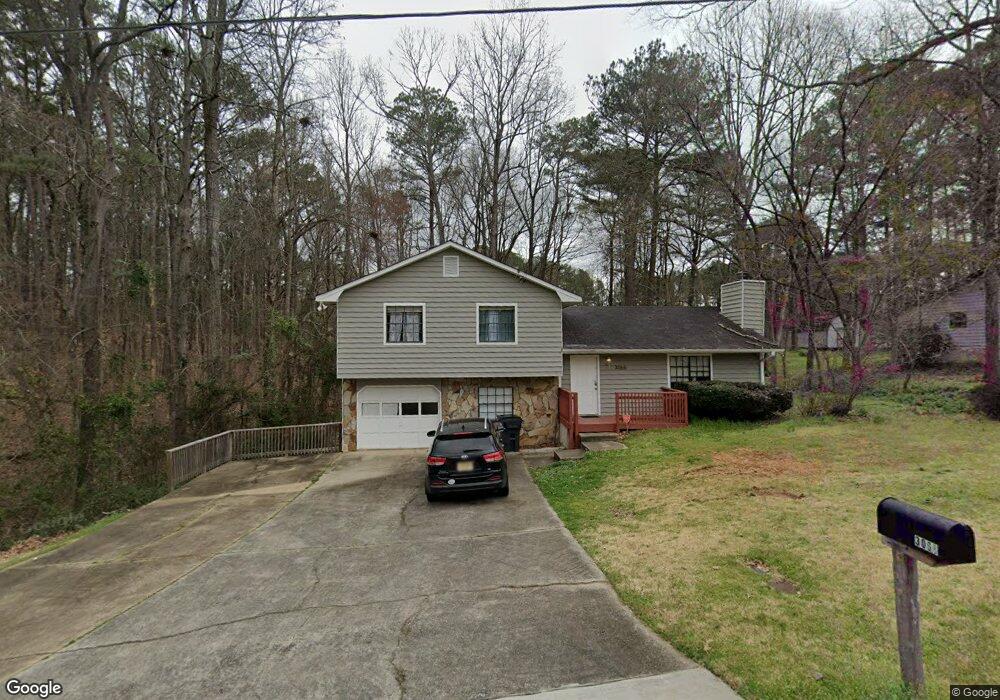
3066 Arden Way SW Snellville, GA 30039
Estimated Value: $272,000 - $310,000
3
Beds
2
Baths
1,248
Sq Ft
$232/Sq Ft
Est. Value
About This Home
This home is located at 3066 Arden Way SW, Snellville, GA 30039 and is currently estimated at $290,139, approximately $232 per square foot. 3066 Arden Way SW is a home located in Gwinnett County with nearby schools including Partee Elementary School, Shiloh Middle School, and Shiloh High School.
Ownership History
Date
Name
Owned For
Owner Type
Purchase Details
Closed on
Dec 9, 2021
Sold by
Resi Tl1 Borrower Llc
Bought by
Home Sfr Borrower Iv Llc
Current Estimated Value
Purchase Details
Closed on
Apr 6, 2017
Sold by
Not Provided
Bought by
Resi Tl1 Borrower Llc
Purchase Details
Closed on
May 4, 2016
Sold by
Bayview Loan Servicing Llc
Bought by
Resi Sfr Sub Llc
Purchase Details
Closed on
Sep 1, 2015
Sold by
Collins Marcia
Bought by
Bayview Loan Servicing Llc
Purchase Details
Closed on
Oct 17, 2003
Sold by
Prather Jerry P
Bought by
Collins Marcia
Home Financials for this Owner
Home Financials are based on the most recent Mortgage that was taken out on this home.
Original Mortgage
$124,431
Interest Rate
6.45%
Mortgage Type
FHA
Purchase Details
Closed on
Apr 28, 1999
Sold by
Lytle David A and Lytle Kathy H
Bought by
Prather Jerry P
Home Financials for this Owner
Home Financials are based on the most recent Mortgage that was taken out on this home.
Original Mortgage
$79,300
Interest Rate
7%
Mortgage Type
New Conventional
Create a Home Valuation Report for This Property
The Home Valuation Report is an in-depth analysis detailing your home's value as well as a comparison with similar homes in the area
Home Values in the Area
Average Home Value in this Area
Purchase History
| Date | Buyer | Sale Price | Title Company |
|---|---|---|---|
| Home Sfr Borrower Iv Llc | -- | -- | |
| Resi Tl1 Borrower Llc | -- | -- | |
| Resi Sfr Sub Llc | $85,100 | -- | |
| Bayview Loan Servicing Llc | $118,750 | -- | |
| Collins Marcia | $126,400 | -- | |
| Prather Jerry P | $83,500 | -- |
Source: Public Records
Mortgage History
| Date | Status | Borrower | Loan Amount |
|---|---|---|---|
| Previous Owner | Collins Marcia | $124,431 | |
| Previous Owner | Prather Jerry P | $79,300 |
Source: Public Records
Tax History Compared to Growth
Tax History
| Year | Tax Paid | Tax Assessment Tax Assessment Total Assessment is a certain percentage of the fair market value that is determined by local assessors to be the total taxable value of land and additions on the property. | Land | Improvement |
|---|---|---|---|---|
| 2024 | $4,151 | $107,360 | $23,720 | $83,640 |
| 2023 | $4,151 | $62,000 | $15,200 | $46,800 |
| 2022 | $2,506 | $62,000 | $15,200 | $46,800 |
| 2021 | $2,332 | $66,400 | $15,200 | $51,200 |
| 2020 | $2,383 | $57,520 | $10,000 | $47,520 |
| 2019 | $2,301 | $57,520 | $10,000 | $47,520 |
| 2018 | $1,977 | $48,360 | $10,000 | $38,360 |
| 2016 | $1,605 | $43,720 | $8,000 | $35,720 |
| 2015 | $1,400 | $30,920 | $4,800 | $26,120 |
| 2014 | -- | $30,920 | $4,800 | $26,120 |
Source: Public Records
Map
Nearby Homes
- 3049 Sutter Ct SW
- 3018 Wilsone Place
- 3388 Kessock Ridge Trail
- 1570 Stacy Dr Unit Lot 6
- 1560 Stacy Dr
- 1570 Stacy Dr
- 2910 Spring Ridge Cir
- 3188 Arbor Oaks Way
- 3301 Kessock Ridge Trail
- 3830 Kittery Point
- 3352 Kittery Dr
- 3258 Kessock Ridge Trail
- 3239 Arbor Oaks Dr
- 3935 Zoar Church Rd
- 3822 Holland Dr
- 3270 Arbor Oaks Dr SW
- 4196 Jami Ln
- 2857 Mountbery Dr
- 3299 Arbor Oaks Dr
- 3209 Moon Stone Ln
- 3066 Arden Way
- 3076 Arden Way
- 0 Arden Way SW Unit 8697317
- 0 Arden Way SW Unit 8069293
- 0 Arden Way SW Unit 8258298
- 0 Arden Way SW Unit 8597658
- 0 Arden Way SW Unit 8890939
- 0 Arden Way SW Unit 8083785
- 0 Arden Way SW Unit 7375858
- 0 Arden Way SW Unit 9048499
- 3086 Arden Way
- 3055 Arden Way
- 3046 Arden Way Unit 1
- 3075 Arden Way
- 3096 Arden Way Unit 2
- 3987 Jami Ln
- 3036 Arden Way
- 3085 Arden Way Unit 2
- 3986 Jami Ln
- 3035 Arden Way