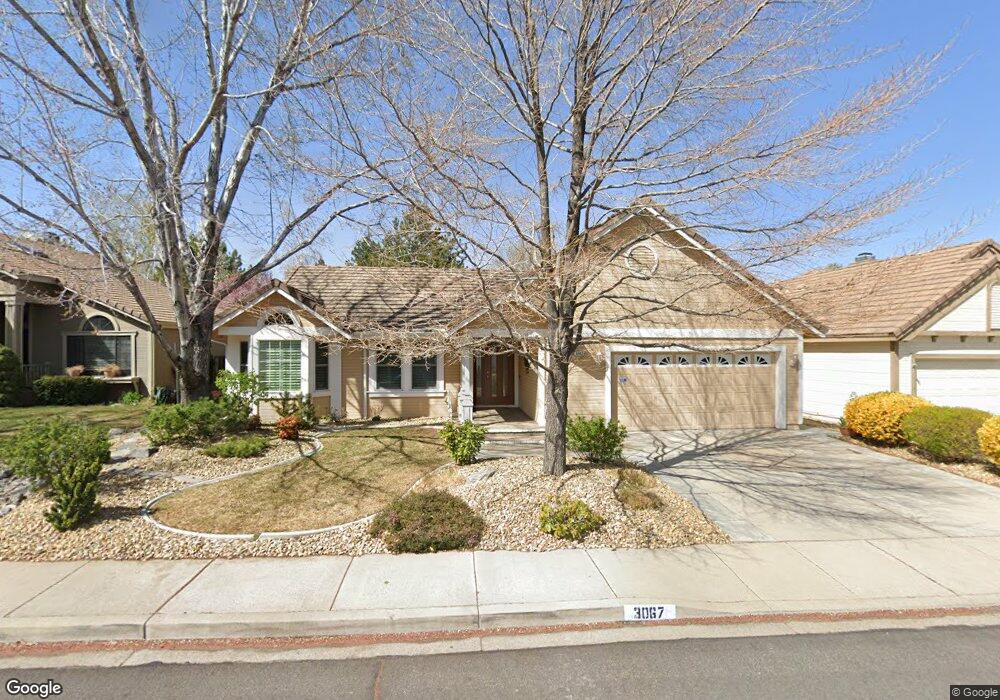
3067 Bramble Dr Reno, NV 89509
Mayberry NeighborhoodEstimated Value: $665,000 - $732,000
3
Beds
2
Baths
1,811
Sq Ft
$381/Sq Ft
Est. Value
About This Home
This home is located at 3067 Bramble Dr, Reno, NV 89509 and is currently estimated at $689,304, approximately $380 per square foot. 3067 Bramble Dr is a home located in Washoe County with nearby schools including Roy Gomm Elementary School, Darrell C Swope Middle School, and Reno High School.
Ownership History
Date
Name
Owned For
Owner Type
Purchase Details
Closed on
Jun 24, 2004
Sold by
Moore Ingrid M
Bought by
Moore Ingrid M E and Moore Living Trust
Current Estimated Value
Purchase Details
Closed on
Aug 21, 2003
Sold by
Davis Bradley D
Bought by
Moore Ingrid M
Home Financials for this Owner
Home Financials are based on the most recent Mortgage that was taken out on this home.
Original Mortgage
$160,000
Outstanding Balance
$69,636
Interest Rate
5.46%
Mortgage Type
Unknown
Estimated Equity
$619,668
Purchase Details
Closed on
Feb 13, 2003
Sold by
Compton Marvin D and Compton Grace K
Bought by
Davis Bradley D
Home Financials for this Owner
Home Financials are based on the most recent Mortgage that was taken out on this home.
Original Mortgage
$247,000
Interest Rate
4.87%
Purchase Details
Closed on
Jan 9, 2002
Sold by
Gabrielli Gene
Bought by
Compton Marvin D and Compton Grace K
Purchase Details
Closed on
Jul 10, 2001
Sold by
Gabrielli Lillian
Bought by
Gabrielli Lillian and Lillian Gabrielli Trust
Create a Home Valuation Report for This Property
The Home Valuation Report is an in-depth analysis detailing your home's value as well as a comparison with similar homes in the area
Home Values in the Area
Average Home Value in this Area
Purchase History
| Date | Buyer | Sale Price | Title Company |
|---|---|---|---|
| Moore Ingrid M E | -- | -- | |
| Moore Ingrid M | $336,700 | First Centennial Title Co | |
| Davis Bradley D | $259,000 | Western Title Incorporated | |
| Compton Marvin D | $222,000 | Stewart Title Northern Nevad | |
| Gabrielli Lillian | -- | -- |
Source: Public Records
Mortgage History
| Date | Status | Borrower | Loan Amount |
|---|---|---|---|
| Open | Moore Ingrid M | $160,000 | |
| Previous Owner | Davis Bradley D | $247,000 |
Source: Public Records
Tax History Compared to Growth
Tax History
| Year | Tax Paid | Tax Assessment Tax Assessment Total Assessment is a certain percentage of the fair market value that is determined by local assessors to be the total taxable value of land and additions on the property. | Land | Improvement |
|---|---|---|---|---|
| 2025 | $2,958 | $110,232 | $50,939 | $59,293 |
| 2024 | $2,958 | $109,238 | $48,745 | $60,493 |
| 2023 | $2,086 | $107,001 | $49,077 | $57,924 |
| 2022 | $2,789 | $88,420 | $39,601 | $48,820 |
| 2021 | $2,708 | $79,702 | $30,690 | $49,012 |
| 2020 | $2,626 | $80,653 | $31,089 | $49,564 |
| 2019 | $2,551 | $76,824 | $28,396 | $48,428 |
| 2018 | $2,479 | $70,031 | $22,444 | $47,587 |
| 2017 | $2,405 | $68,774 | $20,748 | $48,026 |
| 2016 | $2,344 | $68,315 | $18,720 | $49,595 |
| 2015 | $590 | $66,617 | $16,625 | $49,992 |
| 2014 | $2,272 | $62,671 | $13,899 | $48,772 |
| 2013 | -- | $60,115 | $12,868 | $47,247 |
Source: Public Records
Map
Nearby Homes
- 1460 Shewmaker Ct
- 3495 W Plumb Ln
- 1104 Ryegrass Ct
- 2085 La Fond Dr
- 2095 La Fond Dr
- 1755 Benjamin Franklin Dr
- 3274 Alum Creek Ct
- 2024 Regent St
- 3945 San Donato Loop
- 3990 San Donato Loop
- 870 Lyman Ave
- 4184 Del Curto Dr
- 3323 Spring Creek Cir
- 4180 Del Curto Dr
- 1905 Von Way
- 3164 Orrizonte Terrace
- 4090 Goodsell Ln
- 4000 Goodsell Ln
- 1740 McNevin Ct
- 4060 Goodsell Ln
- 3073 Bramble Dr
- 3063 Bramble Dr
- 3057 Bramble Dr
- 3079 Bramble Dr
- 3070 Bramble Dr
- 3068 Bramble Dr
- 3060 Bramble Dr
- 3051 Bramble Dr
- 3056 Bramble Dr
- 1535 Fescue Ct
- 1540 Fescue Ct Unit 1
- 3045 Bramble Dr
- 3089 Bramble Dr
- 3050 Bramble Dr
- 1490 Joshua Dr
- 1485 Joshua Dr
- 1545 Fescue Ct
- 3046 Bramble Dr
- 1560 Fescue Ct Unit 1
- 1532 Bramble Ct