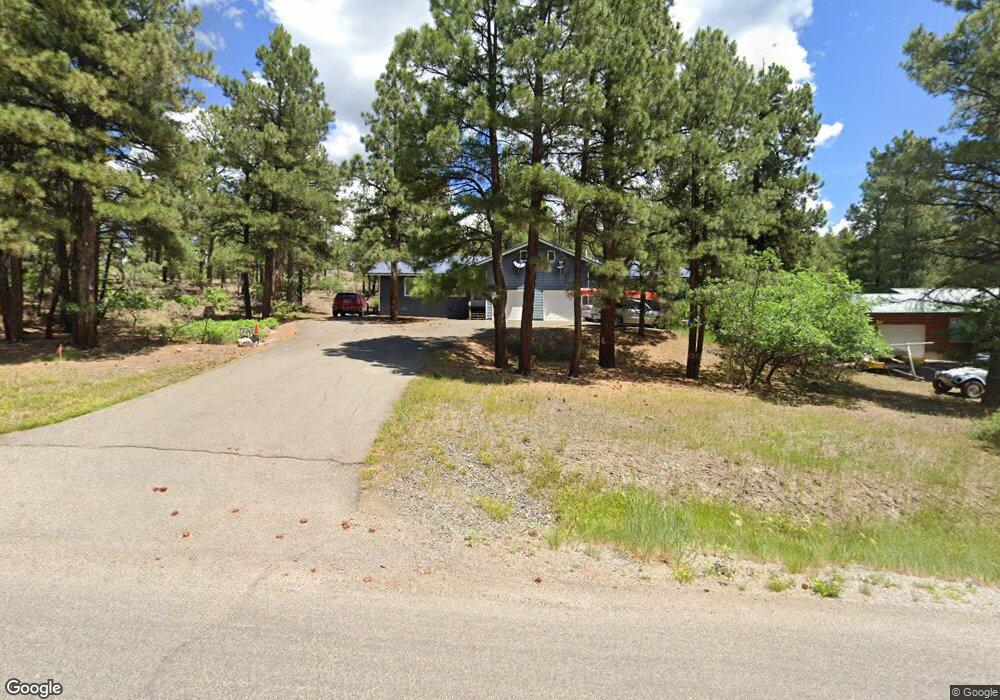
307 Aspenglow Blvd Unit A&B Pagosa Springs, CO 81147
Estimated Value: $533,341 - $781,000
2
Beds
4
Baths
2,096
Sq Ft
$287/Sq Ft
Est. Value
About This Home
This home is located at 307 Aspenglow Blvd Unit A&B, Pagosa Springs, CO 81147 and is currently estimated at $601,835, approximately $287 per square foot. 307 Aspenglow Blvd Unit A&B is a home located in Archuleta County with nearby schools including Pagosa Springs Elementary School, Pagosa Springs Middle School, and Pagosa Springs High School.
Ownership History
Date
Name
Owned For
Owner Type
Purchase Details
Closed on
Mar 8, 2019
Sold by
Cooney & Associates Inc
Bought by
Larsen Richard A and Larsen Carol J
Current Estimated Value
Purchase Details
Closed on
Mar 5, 2018
Sold by
Walsh Morgan
Bought by
Cooney & Associates Inc
Purchase Details
Closed on
Apr 13, 2001
Sold by
Rice Andrew D
Bought by
Walsh Morgan
Purchase Details
Closed on
Mar 5, 2001
Sold by
Underwood R Lynn
Bought by
Rice Andrew D
Purchase Details
Closed on
Feb 20, 2001
Sold by
Brown Tim
Bought by
Walsh Morgan
Purchase Details
Closed on
Mar 31, 1999
Sold by
Been Michael
Bought by
Brown Tim
Purchase Details
Closed on
Nov 14, 1996
Sold by
District Court
Bought by
Been Carolyn
Purchase Details
Closed on
Jun 18, 1996
Sold by
Zacher Glenn H
Bought by
Been Carolyn
Purchase Details
Closed on
May 15, 1979
Sold by
Fpi
Bought by
Zacher Glenn H
Create a Home Valuation Report for This Property
The Home Valuation Report is an in-depth analysis detailing your home's value as well as a comparison with similar homes in the area
Home Values in the Area
Average Home Value in this Area
Purchase History
| Date | Buyer | Sale Price | Title Company |
|---|---|---|---|
| Larsen Richard A | -- | None Available | |
| Cooney & Associates Inc | $275,000 | High Country Title | |
| Walsh Morgan | -- | -- | |
| Rice Andrew D | $12,500 | -- | |
| Walsh Morgan | $197,500 | -- | |
| Brown Tim | $9,000 | -- | |
| Been Carolyn | -- | -- | |
| Been Carolyn | -- | -- | |
| Zacher Glenn H | $14,500 | -- |
Source: Public Records
Tax History Compared to Growth
Tax History
| Year | Tax Paid | Tax Assessment Tax Assessment Total Assessment is a certain percentage of the fair market value that is determined by local assessors to be the total taxable value of land and additions on the property. | Land | Improvement |
|---|---|---|---|---|
| 2024 | $1,987 | $32,790 | $3,290 | $29,500 |
| 2023 | $1,987 | $32,790 | $3,290 | $29,500 |
| 2022 | $1,673 | $25,740 | $1,900 | $23,840 |
| 2021 | $1,854 | $27,060 | $2,000 | $25,060 |
| 2020 | $1,451 | $20,520 | $1,290 | $19,230 |
| 2019 | $1,409 | $20,520 | $1,290 | $19,230 |
| 2018 | $1,457 | $19,320 | $860 | $18,460 |
| 2017 | $1,277 | $19,320 | $860 | $18,460 |
| 2016 | $775 | $11,580 | $800 | $10,780 |
| 2015 | -- | $11,580 | $800 | $10,780 |
| 2014 | -- | $11,860 | $960 | $10,900 |
Source: Public Records
Map
Nearby Homes
- 2266 Cr 600
- 282 Aspenglow Blvd
- 95 Enchanted Place
- 821 Aspenglow Blvd
- 78 Heather Place
- 1318 Cloud Cap Ave
- 46 Carefree Place
- 151 Butte Dr
- 165 Butte Dr
- 29 Monument Ave
- 40 Laurel Dr
- 44 Monument Ave
- 12 Monument Ave
- 698 Monument Ave
- 151 Escobar Ave
- 338 Escobar Ave
- 25 Ermine Ct
- 32 Ermine Ct
- 269 Cloud Cap Ave Unit D1
- 240 Glade Dr
- 307 Aspenglow Blvd
- 287 Aspenglow Blvd
- 2266 Piedra Rd
- 2240 County Road 600
- 267 Aspenglow Blvd
- 2218 Piedra Rd
- 174 Fiesta Place
- 282 Aspenglow Blvd Unit D
- 282 Aspenglow Blvd Unit 6
- 282 Aspenglow Blvd Unit 5
- 282 Aspenglow Blvd Unit 4
- 282 Aspenglow Blvd Unit 1
- 282 Aspenglow Blvd Unit 2
- 282 Aspenglow Blvd Unit 3
- 282 Aspenglow Blvd Unit C
- 243 Aspenglow Blvd
- 59 Steven's Lake Rd
- 59 Stevens Lake Rd
- 169 Gala Place
- 166 Fiesta Place