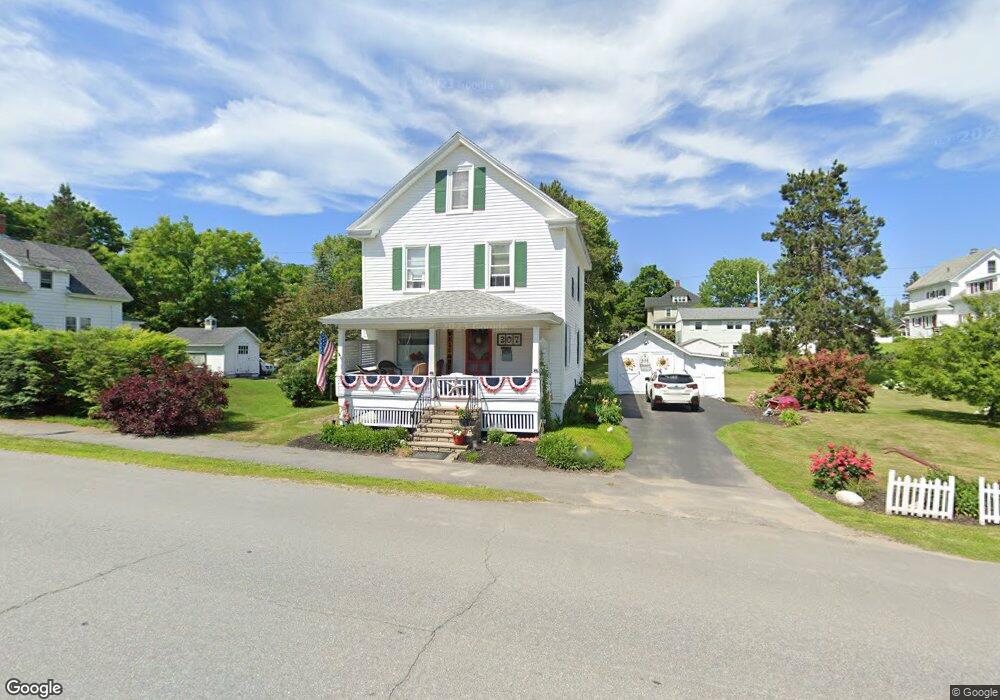
307 Buck St Bangor, ME 04401
West Bangor NeighborhoodEstimated Value: $262,000 - $304,000
3
Beds
1
Bath
1,288
Sq Ft
$217/Sq Ft
Est. Value
About This Home
This home is located at 307 Buck St, Bangor, ME 04401 and is currently estimated at $279,121, approximately $216 per square foot. 307 Buck St is a home located in Penobscot County with nearby schools including Vine Street School, Fairmount School, and James F. Doughty School.
Ownership History
Date
Name
Owned For
Owner Type
Purchase Details
Closed on
Nov 30, 2007
Sold by
Mcdonald Joseph A
Bought by
Mcdonald Marlene G
Current Estimated Value
Purchase Details
Closed on
Jan 26, 2006
Sold by
Mcdonald Joseph A
Bought by
Mcdonald Joseph A and Mcdonald Marlene G
Create a Home Valuation Report for This Property
The Home Valuation Report is an in-depth analysis detailing your home's value as well as a comparison with similar homes in the area
Home Values in the Area
Average Home Value in this Area
Purchase History
| Date | Buyer | Sale Price | Title Company |
|---|---|---|---|
| Mcdonald Marlene G | -- | -- | |
| Mcdonald Joseph A | -- | -- | |
| Mcdonald Joseph A | -- | -- |
Source: Public Records
Mortgage History
| Date | Status | Borrower | Loan Amount |
|---|---|---|---|
| Open | Mcdonald Marlene G | $104,970 | |
| Closed | Mcdonald Marlene G | $117,000 |
Source: Public Records
Tax History Compared to Growth
Tax History
| Year | Tax Paid | Tax Assessment Tax Assessment Total Assessment is a certain percentage of the fair market value that is determined by local assessors to be the total taxable value of land and additions on the property. | Land | Improvement |
|---|---|---|---|---|
| 2024 | $4,189 | $225,800 | $29,800 | $196,000 |
| 2023 | $3,956 | $206,600 | $29,800 | $176,800 |
| 2022 | $3,686 | $180,700 | $29,800 | $150,900 |
| 2021 | $3,555 | $159,400 | $27,600 | $131,800 |
| 2020 | $3,508 | $151,200 | $26,800 | $124,400 |
| 2019 | $3,370 | $146,500 | $26,800 | $119,700 |
| 2018 | $3,199 | $139,400 | $26,800 | $112,600 |
| 2017 | $2,316 | $138,600 | $26,800 | $111,800 |
| 2016 | $2,247 | $135,700 | $26,800 | $108,900 |
| 2015 | $3,009 | $137,100 | $26,800 | $110,300 |
| 2014 | $2,936 | $134,700 | $26,800 | $107,900 |
| 2013 | $2,802 | $134,700 | $26,800 | $107,900 |
Source: Public Records
Map
Nearby Homes