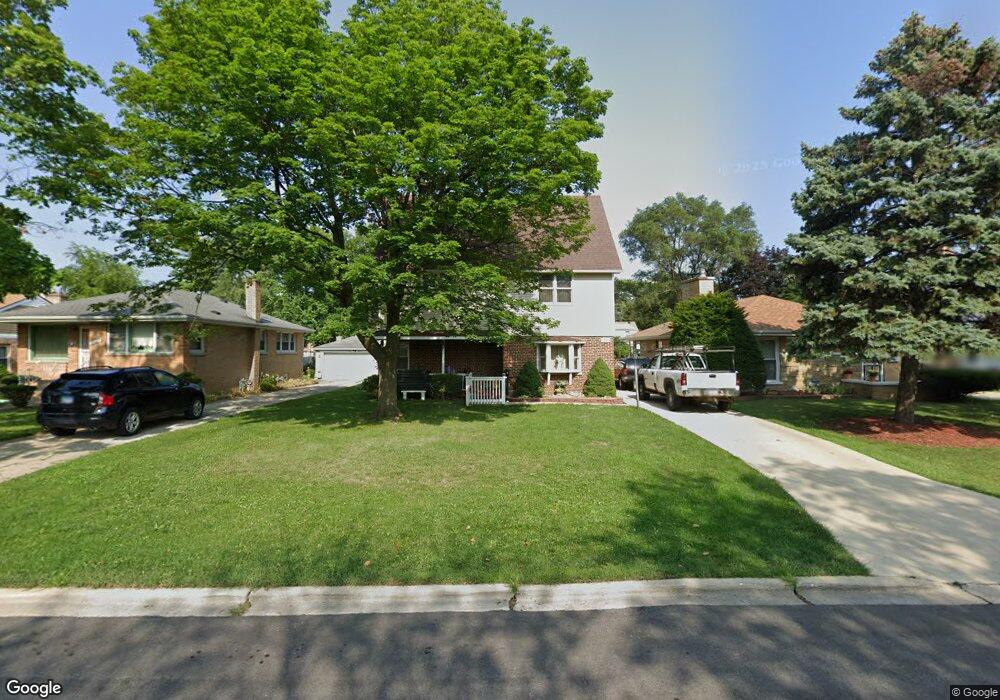
307 Buckthorn Ln Hillside, IL 60162
Estimated Value: $299,000 - $347,000
2
Beds
2
Baths
1,728
Sq Ft
$184/Sq Ft
Est. Value
About This Home
This home is located at 307 Buckthorn Ln, Hillside, IL 60162 and is currently estimated at $318,026, approximately $184 per square foot. 307 Buckthorn Ln is a home located in Cook County with nearby schools including Hillside Elementary School and Proviso West High School.
Ownership History
Date
Name
Owned For
Owner Type
Purchase Details
Closed on
Feb 23, 2006
Sold by
Zeh Reyna C
Bought by
Zeh Daniel and Zeh Reyna C
Current Estimated Value
Home Financials for this Owner
Home Financials are based on the most recent Mortgage that was taken out on this home.
Original Mortgage
$198,500
Outstanding Balance
$123,186
Interest Rate
8.3%
Mortgage Type
Unknown
Estimated Equity
$194,840
Purchase Details
Closed on
Aug 11, 2003
Sold by
Zeh F and Zeh Reyna C
Bought by
Zeh Reyna C
Home Financials for this Owner
Home Financials are based on the most recent Mortgage that was taken out on this home.
Original Mortgage
$108,700
Interest Rate
6.33%
Mortgage Type
Unknown
Purchase Details
Closed on
May 27, 1994
Sold by
Cutrara Randy W and Cutrara Rhonda J
Bought by
Zeh Daniel F and Zeh Reyna C
Home Financials for this Owner
Home Financials are based on the most recent Mortgage that was taken out on this home.
Original Mortgage
$100,869
Interest Rate
8.48%
Mortgage Type
FHA
Create a Home Valuation Report for This Property
The Home Valuation Report is an in-depth analysis detailing your home's value as well as a comparison with similar homes in the area
Home Values in the Area
Average Home Value in this Area
Purchase History
| Date | Buyer | Sale Price | Title Company |
|---|---|---|---|
| Zeh Daniel | -- | Tristar Title Llc | |
| Zeh Reyna C | -- | Cti | |
| Zeh Daniel F | $101,500 | -- |
Source: Public Records
Mortgage History
| Date | Status | Borrower | Loan Amount |
|---|---|---|---|
| Open | Zeh Daniel | $198,500 | |
| Closed | Zeh Reyna C | $108,700 | |
| Closed | Zeh Daniel F | $100,869 |
Source: Public Records
Tax History
| Year | Tax Paid | Tax Assessment Tax Assessment Total Assessment is a certain percentage of the fair market value that is determined by local assessors to be the total taxable value of land and additions on the property. | Land | Improvement |
|---|---|---|---|---|
| 2025 | $8,126 | $26,000 | $3,396 | $22,604 |
| 2024 | $8,126 | $26,000 | $3,396 | $22,604 |
| 2023 | $7,091 | $26,000 | $3,396 | $22,604 |
| 2022 | $7,091 | $21,395 | $2,933 | $18,462 |
| 2021 | $6,976 | $21,394 | $2,933 | $18,461 |
| 2020 | $6,864 | $21,394 | $2,933 | $18,461 |
| 2019 | $6,153 | $18,773 | $2,624 | $16,149 |
| 2018 | $5,976 | $18,773 | $2,624 | $16,149 |
| 2017 | $5,765 | $18,773 | $2,624 | $16,149 |
| 2016 | $5,131 | $15,912 | $2,315 | $13,597 |
| 2015 | $4,918 | $15,912 | $2,315 | $13,597 |
| 2014 | $4,813 | $15,912 | $2,315 | $13,597 |
| 2013 | $5,066 | $17,986 | $2,315 | $15,671 |
Source: Public Records
Map
Nearby Homes
- 311 Buckthorn Ln
- 326 N Forest Ave
- 4353 Butterfield Rd
- 70 N Laverne Ave
- 500 N Laverne Ave
- 605 N Wolf Rd Unit B9
- 512 50th Ave
- 226 N Lind Ave
- 540 47th Ave
- 768 N Rohde Ave
- 250 N Irving Ave
- 504 N Irving Ave
- 429 Geneva Ave
- 443 Granville Ave
- 4904 W Hawthorne Ave
- 3912 Adams St
- 4938 W Randolph St
- 4929 W Randolph St
- 241 48th Ave
- 1426 N Rohde Ave
Your Personal Tour Guide
Ask me questions while you tour the home.