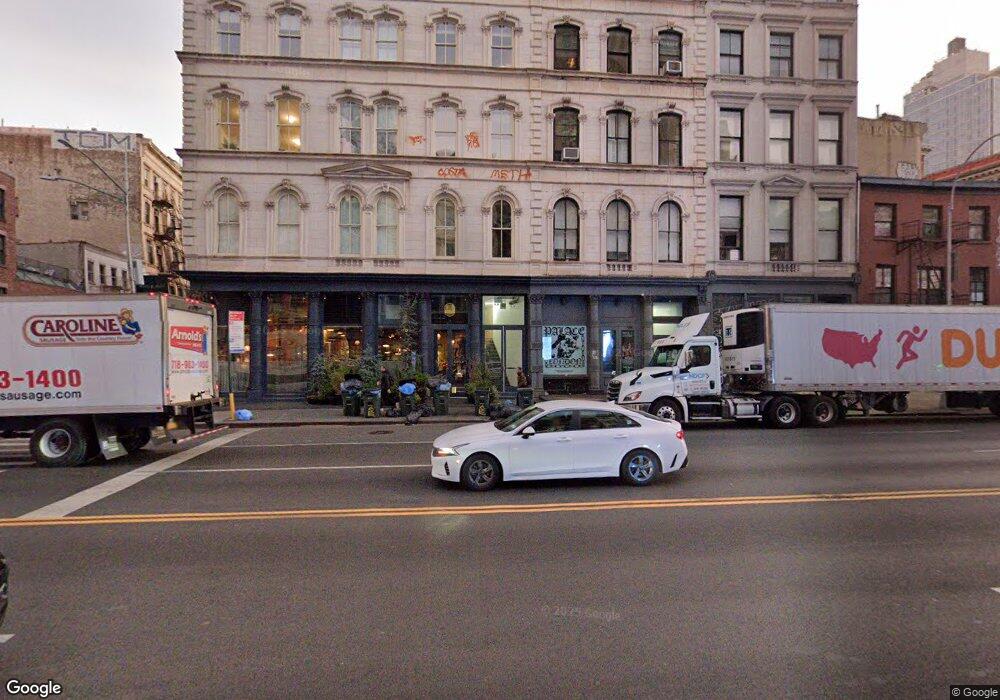
307 Canal St Unit 4S New York, NY 10013
SoHo NeighborhoodEstimated Value: $2,516,000 - $3,880,052
--
Bed
--
Bath
1,813
Sq Ft
$1,876/Sq Ft
Est. Value
About This Home
This home is located at 307 Canal St Unit 4S, New York, NY 10013 and is currently estimated at $3,402,013, approximately $1,876 per square foot. 307 Canal St Unit 4S is a home located in New York County with nearby schools including P.S. 130 - Hernando De Soto, Middle School 297, and Lower Manhattan Community Middle School.
Ownership History
Date
Name
Owned For
Owner Type
Purchase Details
Closed on
Jul 16, 2021
Sold by
Manhattan Howard Street Llc
Bought by
Stuart Lyall
Current Estimated Value
Purchase Details
Closed on
Dec 12, 2014
Sold by
Allen Karl and Allen Kevin
Bought by
Manhattan Howard Street Llc
Home Financials for this Owner
Home Financials are based on the most recent Mortgage that was taken out on this home.
Original Mortgage
$1,295,000
Interest Rate
3.99%
Mortgage Type
Purchase Money Mortgage
Purchase Details
Closed on
Jan 10, 2014
Sold by
Hoffman Christopher
Bought by
Allen Karl and Allen Kevin
Purchase Details
Closed on
Feb 5, 2008
Sold by
307 Canal Street Ltd
Bought by
Hoffman Christopher
Create a Home Valuation Report for This Property
The Home Valuation Report is an in-depth analysis detailing your home's value as well as a comparison with similar homes in the area
Home Values in the Area
Average Home Value in this Area
Purchase History
| Date | Buyer | Sale Price | Title Company |
|---|---|---|---|
| Stuart Lyall | $1,660,000 | -- | |
| Manhattan Howard Street Llc | $1,850,000 | -- | |
| Allen Karl | $1,600,000 | -- | |
| Hoffman Christopher | $1,425,550 | -- |
Source: Public Records
Mortgage History
| Date | Status | Borrower | Loan Amount |
|---|---|---|---|
| Previous Owner | Manhattan Howard Street Llc | $1,295,000 |
Source: Public Records
Tax History Compared to Growth
Tax History
| Year | Tax Paid | Tax Assessment Tax Assessment Total Assessment is a certain percentage of the fair market value that is determined by local assessors to be the total taxable value of land and additions on the property. | Land | Improvement |
|---|---|---|---|---|
| 2025 | $28,699 | $229,554 | $6,017 | $223,537 |
| 2024 | $28,699 | $229,554 | $13,770 | $224,740 |
| 2023 | $27,287 | $222,439 | $5,598 | $216,841 |
| 2022 | $25,199 | $592,740 | $13,770 | $578,970 |
| 2021 | $23,394 | $602,190 | $13,770 | $588,420 |
| 2020 | $22,025 | $584,640 | $13,770 | $570,870 |
| 2019 | $22,270 | $487,188 | $13,770 | $473,418 |
| 2018 | $21,763 | $171,106 | $5,803 | $165,303 |
| 2017 | $20,151 | $158,432 | $6,078 | $152,354 |
| 2016 | $18,912 | $146,697 | $6,207 | $140,490 |
| 2015 | $12,060 | $135,831 | $6,084 | $129,747 |
| 2014 | $12,060 | $135,831 | $5,069 | $130,762 |
Source: Public Records
Map
Nearby Homes
- 10 Greene St Unit PENTHOUSE
- 20 Greene St Unit PH
- 50 Lispenard St Unit 4
- 46 Lispenard St Unit 5E
- 46 Lispenard St Unit 4E
- 274 Canal St
- 35 Mercer St Unit 3W
- 40 Mercer St Unit 7
- 31 Greene St Unit 1
- 14-16 Wooster St Unit 2
- 51 Walker St Unit 8B
- 32 Walker St Unit RESIDENCE4
- 47 Walker St Unit 3A
- 45 Walker St Unit PH
- 55 Walker St Unit 4A
- 55 Walker St Unit PH
- 129 Lafayette St Unit 8C
- 22 Wooster St Unit PHN
- 395 Broadway Unit 4E
- 395 Broadway Unit 7E
- 305 Canal St
- 305 Canal St Unit 1
- 305 Canal St Unit 4
- 305 Canal St Unit 5
- 305 Canal St Unit 2
- 305 Canal St Unit 3
- 307 Canal St Unit 5N
- 307 Canal St Unit 5S
- 307 Canal St Unit 4N
- 307 Canal St Unit 3N
- 307 Canal St Unit 3S
- 307 Canal St Unit CU2
- 307 Canal St Unit CU1
- 307 Canal St
- 303 Canal St
- 309-311 Canal St
- 47 Howard St Unit 2
- 47 Howard St Unit 5
- 49 Howard St Unit PH 5 S
- 49 Howard St Unit 4N