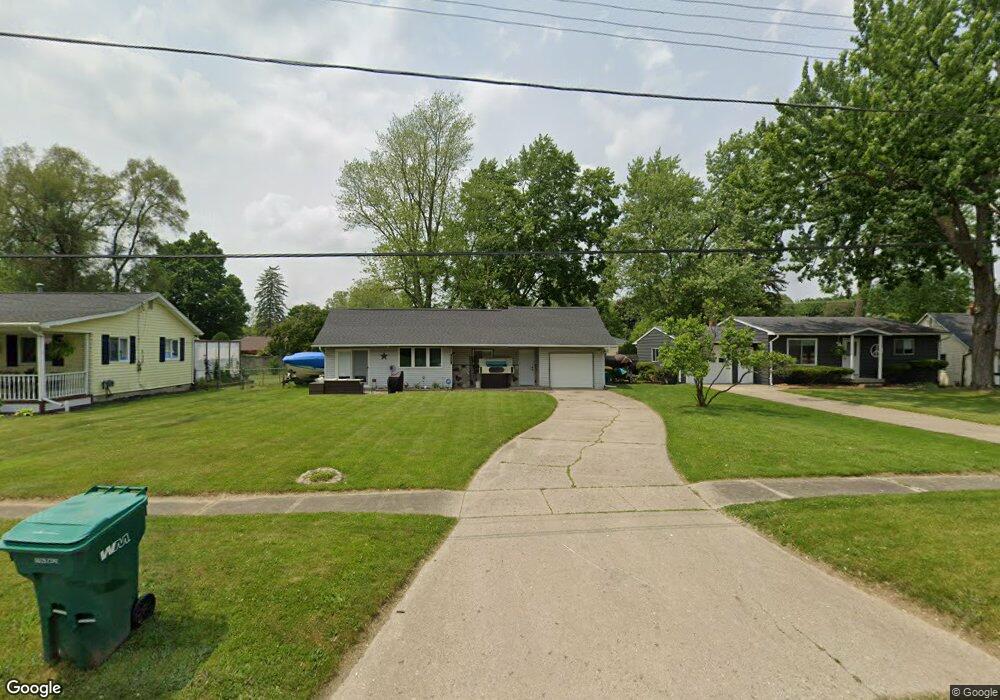
307 Chestnut St Unit Bldg-Unit Flushing, MI 48433
Estimated Value: $123,000 - $150,000
Studio
1
Bath
852
Sq Ft
$162/Sq Ft
Est. Value
About This Home
This home is located at 307 Chestnut St Unit Bldg-Unit, Flushing, MI 48433 and is currently estimated at $137,929, approximately $161 per square foot. 307 Chestnut St Unit Bldg-Unit is a home located in Genesee County with nearby schools including Springview Elementary School, Flushing Middle School, and Flushing High School.
Ownership History
Date
Name
Owned For
Owner Type
Purchase Details
Closed on
Feb 15, 2022
Sold by
Andrea Flores
Bought by
Simon Kyle
Current Estimated Value
Purchase Details
Closed on
Jan 26, 2018
Sold by
Us Bank Trust National Association
Bought by
Flores Andrea
Purchase Details
Closed on
Jun 17, 2015
Sold by
Zapfe Thomas M and Zapfe Wendy K
Bought by
Us Bank Trust National Association and The Prp Ii Pals Investments Trust
Create a Home Valuation Report for This Property
The Home Valuation Report is an in-depth analysis detailing your home's value as well as a comparison with similar homes in the area
Home Values in the Area
Average Home Value in this Area
Purchase History
| Date | Buyer | Sale Price | Title Company |
|---|---|---|---|
| Simon Kyle | $118,000 | Liberty Title | |
| Flores Andrea | $49,500 | Liberty Title | |
| Us Bank Trust National Association | $45,766 | Attorney |
Source: Public Records
Tax History
| Year | Tax Paid | Tax Assessment Tax Assessment Total Assessment is a certain percentage of the fair market value that is determined by local assessors to be the total taxable value of land and additions on the property. | Land | Improvement |
|---|---|---|---|---|
| 2025 | $2,546 | $57,900 | $0 | $0 |
| 2024 | $2,077 | $53,300 | $0 | $0 |
| 2023 | $2,001 | $49,000 | $0 | $0 |
| 2022 | $1,466 | $37,400 | $0 | $0 |
| 2021 | $1,466 | $34,000 | $0 | $0 |
| 2020 | $1,186 | $29,000 | $0 | $0 |
| 2019 | $1,162 | $27,100 | $0 | $0 |
| 2018 | $2,268 | $25,800 | $0 | $0 |
| 2017 | $1,897 | $25,400 | $0 | $0 |
| 2016 | $1,908 | $25,100 | $0 | $0 |
| 2015 | $1,676 | $0 | $0 | $0 |
| 2012 | -- | $33,400 | $33,400 | $0 |
Source: Public Records
Map
Nearby Homes
- 507 Dale St
- 515 Chestnut St
- 1252 Beatrice St
- 1216 Pleasantview Dr
- 426 Bellewood Dr
- 200 Boman St
- 334 Cedarwood Dr
- 317 Oakwood Dr
- 433 Crestview St
- 0 Double Tree Estates
- 530 Coutant St
- 621 Ashwood Dr
- 527 Oakbrook Cir Unit 14
- 162 Beacon Point Pkwy
- Lot 1 across from 74 E River Rd
- 1449 Coutant St
- 0 Crooked Limb Ct
- 748 Bending Ct
- 1436 E Pierson Rd
- 516 Sunnyslope Dr
Your Personal Tour Guide
Ask me questions while you tour the home.