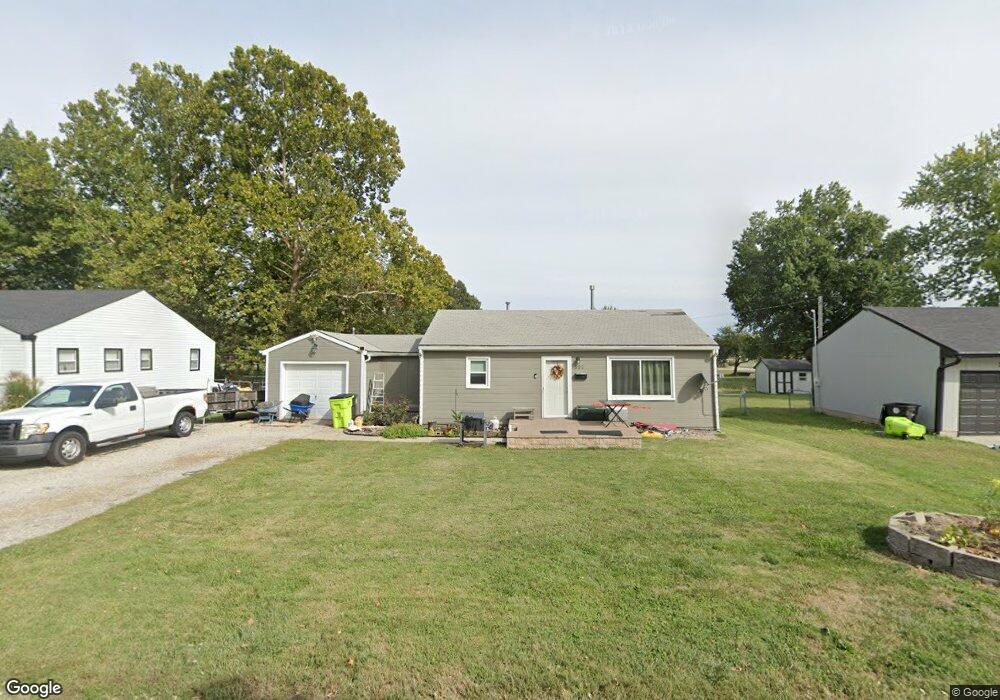
307 E South Ave Unit 309 Belton, MO 64012
Estimated Value: $220,739 - $373,000
4
Beds
2
Baths
1,584
Sq Ft
$181/Sq Ft
Est. Value
About This Home
This home is located at 307 E South Ave Unit 309, Belton, MO 64012 and is currently estimated at $286,685, approximately $180 per square foot. 307 E South Ave Unit 309 is a home located in Cass County with nearby schools including Scott Elementary School, Belton Middle School, and Mill Creek Upper Elementary School.
Ownership History
Date
Name
Owned For
Owner Type
Purchase Details
Closed on
Sep 29, 2025
Sold by
Sands George E and Sands George Elmer
Bought by
Watkins Mary
Current Estimated Value
Home Financials for this Owner
Home Financials are based on the most recent Mortgage that was taken out on this home.
Original Mortgage
$90,000
Outstanding Balance
$89,920
Interest Rate
6.58%
Mortgage Type
Seller Take Back
Estimated Equity
$196,765
Purchase Details
Closed on
Apr 13, 2022
Sold by
Sands Beverly Hebbert
Bought by
Sands George Elmer
Create a Home Valuation Report for This Property
The Home Valuation Report is an in-depth analysis detailing your home's value as well as a comparison with similar homes in the area
Home Values in the Area
Average Home Value in this Area
Purchase History
| Date | Buyer | Sale Price | Title Company |
|---|---|---|---|
| Watkins Mary | -- | Alliance Nationwide Title Agen | |
| Sands George Elmer | -- | None Listed On Document |
Source: Public Records
Mortgage History
| Date | Status | Borrower | Loan Amount |
|---|---|---|---|
| Open | Watkins Mary | $90,000 |
Source: Public Records
Tax History
| Year | Tax Paid | Tax Assessment Tax Assessment Total Assessment is a certain percentage of the fair market value that is determined by local assessors to be the total taxable value of land and additions on the property. | Land | Improvement |
|---|---|---|---|---|
| 2025 | $1,537 | $20,870 | $2,920 | $17,950 |
| 2024 | $1,537 | $18,640 | $2,660 | $15,980 |
| 2023 | $1,533 | $18,640 | $2,660 | $15,980 |
| 2022 | $1,339 | $16,140 | $2,660 | $13,480 |
| 2021 | $1,339 | $16,140 | $2,660 | $13,480 |
| 2020 | $1,312 | $15,720 | $2,660 | $13,060 |
| 2019 | $1,285 | $15,720 | $2,660 | $13,060 |
| 2018 | $1,135 | $14,000 | $2,130 | $11,870 |
| 2017 | $989 | $14,000 | $2,130 | $11,870 |
| 2016 | $989 | $12,130 | $2,130 | $10,000 |
| 2015 | $989 | $12,130 | $2,130 | $10,000 |
| 2014 | $992 | $12,130 | $2,130 | $10,000 |
| 2013 | -- | $12,130 | $2,130 | $10,000 |
Source: Public Records
Map
Nearby Homes
Your Personal Tour Guide
Ask me questions while you tour the home.