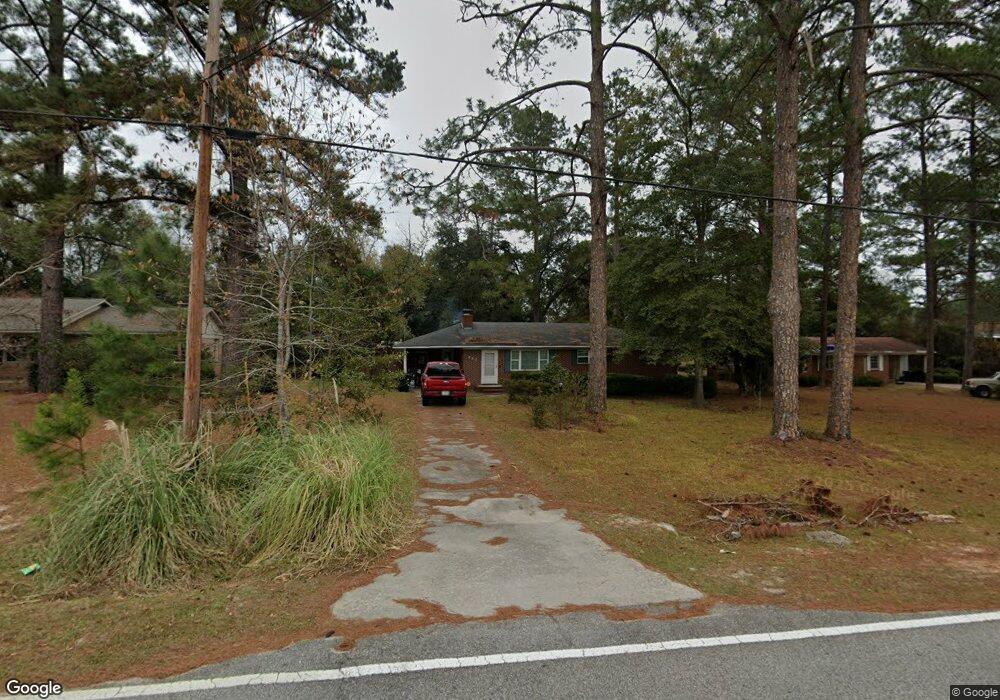
307 Fletcher Dr Statesboro, GA 30458
Estimated Value: $209,000 - $228,000
3
Beds
2
Baths
1,257
Sq Ft
$174/Sq Ft
Est. Value
About This Home
This home is located at 307 Fletcher Dr, Statesboro, GA 30458 and is currently estimated at $218,261, approximately $173 per square foot. 307 Fletcher Dr is a home located in Bulloch County with nearby schools including Mattie Lively Elementary School, Statesboro High School, and William James Middle School.
Ownership History
Date
Name
Owned For
Owner Type
Purchase Details
Closed on
Aug 5, 2021
Sold by
Owens Chandler
Bought by
Barber Victor Allen and Barber Marilyn Jean
Current Estimated Value
Home Financials for this Owner
Home Financials are based on the most recent Mortgage that was taken out on this home.
Original Mortgage
$72,500
Outstanding Balance
$65,925
Interest Rate
2.9%
Mortgage Type
New Conventional
Estimated Equity
$152,336
Purchase Details
Closed on
Jun 4, 2018
Sold by
Jelco Properties Llc
Bought by
Owens Chandler
Home Financials for this Owner
Home Financials are based on the most recent Mortgage that was taken out on this home.
Original Mortgage
$108,000
Interest Rate
4.5%
Mortgage Type
New Conventional
Purchase Details
Closed on
Sep 14, 2017
Sold by
Hodges Franklin L
Bought by
Jelco Properties Llc
Purchase Details
Closed on
Oct 1, 1986
Bought by
Futch Linda S
Create a Home Valuation Report for This Property
The Home Valuation Report is an in-depth analysis detailing your home's value as well as a comparison with similar homes in the area
Home Values in the Area
Average Home Value in this Area
Purchase History
| Date | Buyer | Sale Price | Title Company |
|---|---|---|---|
| Barber Victor Allen | $145,000 | -- | |
| Owens Chandler | $120,000 | -- | |
| Jelco Properties Llc | $37,500 | -- | |
| Futch Linda S | -- | -- |
Source: Public Records
Mortgage History
| Date | Status | Borrower | Loan Amount |
|---|---|---|---|
| Open | Barber Victor Allen | $72,500 | |
| Previous Owner | Owens Chandler | $108,000 |
Source: Public Records
Tax History Compared to Growth
Tax History
| Year | Tax Paid | Tax Assessment Tax Assessment Total Assessment is a certain percentage of the fair market value that is determined by local assessors to be the total taxable value of land and additions on the property. | Land | Improvement |
|---|---|---|---|---|
| 2024 | $1,814 | $71,920 | $10,000 | $61,920 |
| 2023 | $1,758 | $67,160 | $8,000 | $59,160 |
| 2022 | $1,010 | $61,314 | $8,000 | $53,314 |
| 2021 | $783 | $38,833 | $5,520 | $33,313 |
| 2020 | $778 | $37,508 | $5,520 | $31,988 |
| 2019 | $776 | $37,188 | $5,520 | $31,668 |
| 2018 | $707 | $32,458 | $5,520 | $26,938 |
| 2017 | $684 | $31,055 | $5,520 | $25,535 |
| 2016 | $687 | $30,420 | $5,520 | $24,900 |
| 2015 | $689 | $30,370 | $5,520 | $24,850 |
| 2014 | $633 | $30,370 | $5,520 | $24,850 |
Source: Public Records
Map
Nearby Homes
- 113 Nottingham Trail
- 113 Ladd Cir
- 108 Norwood Dr
- 823 N Main St
- 3 Friar Tuck Trail
- 405 N Main St
- 328 N Main St
- 118 Pin Oak Ln Unit 47
- 448 Myrtle Crossing Ln
- 197 Zetterower Rd
- 318 N Main St
- 456 Myrtle Crossing Ln
- 17 E Parrish St
- 7 E Moore St
- 117 Zetterower Rd
- 115 Zetterower Rd
- 11 W Moore St
- 113 Zetterower Rd
- 111 Zetterower Rd
- 107 Fernhill Dr
- 305 Fletcher Dr
- 309 Fletcher Dr
- 303 Fletcher Dr
- 306 Fletcher Dr
- 102 Francis Scott Dr
- 124 Nottingham Trail
- 301 Fletcher Dr
- 311 Fletcher Dr
- 102 Hampton Ave
- 312 Fletcher Dr
- 302 Fletcher Dr
- 104 Hampton Ave
- 0 Fletcher Dr Unit 7453197
- 0 Fletcher Dr Unit 7267475
- 0 Fletcher Dr Unit 8042972
- 0 Fletcher Dr Unit 8436077
- 0 Fletcher Dr Unit 8774920
- 115 Nottingham Trail
- 300 Fletcher Dr
- 120 Nottingham Trail