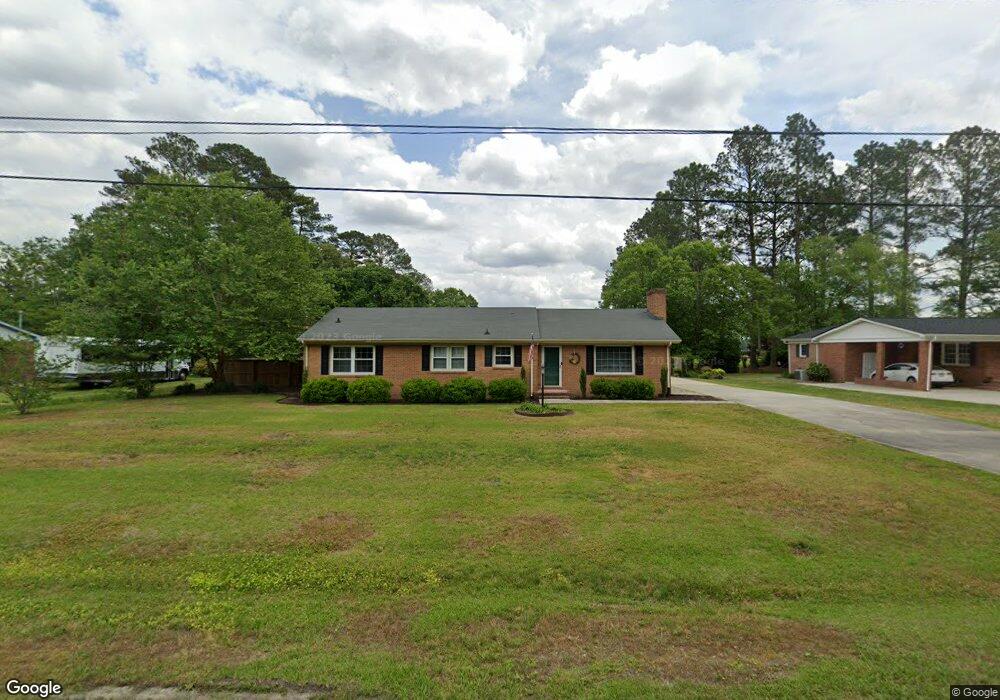
307 Forest Dr La Grange, NC 28551
Estimated Value: $212,000 - $268,000
3
Beds
4
Baths
1,655
Sq Ft
$149/Sq Ft
Est. Value
About This Home
This home is located at 307 Forest Dr, La Grange, NC 28551 and is currently estimated at $247,170, approximately $149 per square foot. 307 Forest Dr is a home located in Lenoir County with nearby schools including La Grange Elementary School, E.B. Frink Middle School, and North Lenoir High School.
Ownership History
Date
Name
Owned For
Owner Type
Purchase Details
Closed on
Jun 17, 2019
Sold by
Hines Gary S and Hines Lauren
Bought by
Creech Edward M and Creech Richard
Current Estimated Value
Purchase Details
Closed on
Nov 20, 2015
Sold by
Moye Kevin Scott and Moye Scott
Bought by
Hines Gary Steven and Hines Lauren
Home Financials for this Owner
Home Financials are based on the most recent Mortgage that was taken out on this home.
Original Mortgage
$114,138
Interest Rate
3.83%
Mortgage Type
FHA
Purchase Details
Closed on
Jul 2, 2007
Sold by
Watts Jerrol Brent and Watts Paula Ann
Bought by
Moye Scott and Moye Elsie
Home Financials for this Owner
Home Financials are based on the most recent Mortgage that was taken out on this home.
Original Mortgage
$102,600
Interest Rate
6.16%
Mortgage Type
New Conventional
Create a Home Valuation Report for This Property
The Home Valuation Report is an in-depth analysis detailing your home's value as well as a comparison with similar homes in the area
Home Values in the Area
Average Home Value in this Area
Purchase History
| Date | Buyer | Sale Price | Title Company |
|---|---|---|---|
| Creech Edward M | $115,000 | -- | |
| Hines Gary Steven | $111,000 | Attorney | |
| Moye Scott | $108,000 | None Available |
Source: Public Records
Mortgage History
| Date | Status | Borrower | Loan Amount |
|---|---|---|---|
| Previous Owner | Hines Gary Steven | $114,138 | |
| Previous Owner | Moye Scott | $102,600 |
Source: Public Records
Tax History
| Year | Tax Paid | Tax Assessment Tax Assessment Total Assessment is a certain percentage of the fair market value that is determined by local assessors to be the total taxable value of land and additions on the property. | Land | Improvement |
|---|---|---|---|---|
| 2025 | $2,269 | $226,148 | $29,440 | $196,708 |
| 2024 | $1,624 | $117,969 | $12,500 | $105,469 |
| 2023 | $1,624 | $117,969 | $12,500 | $105,469 |
| 2022 | $1,624 | $117,969 | $12,500 | $105,469 |
| 2021 | $1,624 | $117,969 | $12,500 | $105,469 |
| 2020 | $1,491 | $108,246 | $12,500 | $95,746 |
| 2019 | $1,491 | $108,246 | $12,500 | $95,746 |
| 2018 | $1,474 | $108,246 | $12,500 | $95,746 |
| 2017 | $1,480 | $108,246 | $12,500 | $95,746 |
| 2014 | $1,380 | $107,390 | $15,000 | $92,390 |
| 2013 | -- | $107,390 | $15,000 | $92,390 |
| 2011 | -- | $107,390 | $15,000 | $92,390 |
Source: Public Records
Map
Nearby Homes
Your Personal Tour Guide
Ask me questions while you tour the home.