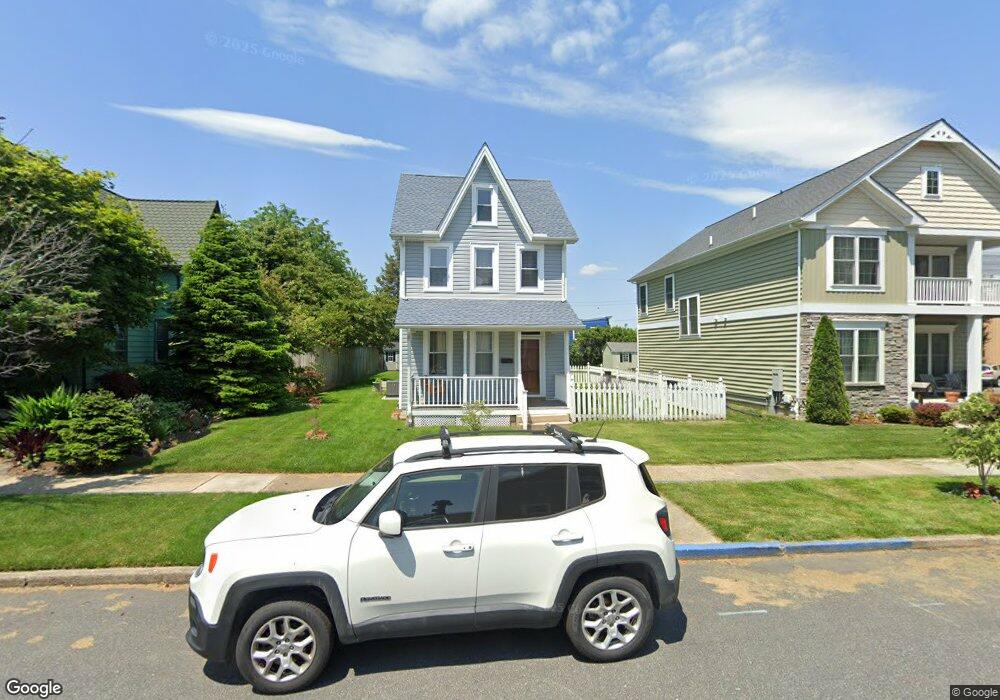
307 Fountain St Havre de Grace, MD 21078
Estimated Value: $279,206 - $501,000
--
Bed
1
Bath
1,440
Sq Ft
$254/Sq Ft
Est. Value
About This Home
This home is located at 307 Fountain St, Havre de Grace, MD 21078 and is currently estimated at $365,552, approximately $253 per square foot. 307 Fountain St is a home located in Harford County with nearby schools including Havre de Grace Elementary School, Havre de Grace Middle School, and Havre de Grace High School.
Ownership History
Date
Name
Owned For
Owner Type
Purchase Details
Closed on
Feb 10, 2025
Sold by
Schenking Spencer W
Bought by
Schenking Spencer W and Schenking Kennedy
Current Estimated Value
Home Financials for this Owner
Home Financials are based on the most recent Mortgage that was taken out on this home.
Original Mortgage
$328,000
Outstanding Balance
$325,582
Interest Rate
6.5%
Mortgage Type
New Conventional
Estimated Equity
$39,970
Purchase Details
Closed on
Sep 9, 2021
Sold by
Mcmichael Shelby J
Bought by
Schenking Spencer W
Purchase Details
Closed on
Aug 4, 1998
Sold by
Mcmichael Patricia
Bought by
Mcmichael Patricia and Mc Michael Shelby J
Purchase Details
Closed on
Jul 13, 1983
Sold by
Mcmichael Lawrence J
Bought by
Mcmichael Patricia
Home Financials for this Owner
Home Financials are based on the most recent Mortgage that was taken out on this home.
Original Mortgage
$24,000
Interest Rate
13.3%
Create a Home Valuation Report for This Property
The Home Valuation Report is an in-depth analysis detailing your home's value as well as a comparison with similar homes in the area
Home Values in the Area
Average Home Value in this Area
Purchase History
| Date | Buyer | Sale Price | Title Company |
|---|---|---|---|
| Schenking Spencer W | -- | Navy Federal Title | |
| Schenking Spencer W | $210,000 | Home Title Co Of Md Inc | |
| Mcmichael Patricia | $66,000 | -- | |
| Mcmichael Patricia | $30,000 | -- |
Source: Public Records
Mortgage History
| Date | Status | Borrower | Loan Amount |
|---|---|---|---|
| Open | Schenking Spencer W | $328,000 | |
| Previous Owner | Mcmichael Patricia | $24,000 | |
| Closed | Mcmichael Patricia | -- |
Source: Public Records
Tax History Compared to Growth
Tax History
| Year | Tax Paid | Tax Assessment Tax Assessment Total Assessment is a certain percentage of the fair market value that is determined by local assessors to be the total taxable value of land and additions on the property. | Land | Improvement |
|---|---|---|---|---|
| 2025 | $1,909 | $213,267 | $0 | $0 |
| 2024 | $1,555 | $200,200 | $67,000 | $133,200 |
| 2023 | $1,555 | $181,633 | $0 | $0 |
| 2022 | $1,777 | $163,067 | $0 | $0 |
| 2021 | $1,633 | $144,500 | $67,000 | $77,500 |
| 2020 | $1,452 | $144,333 | $0 | $0 |
| 2019 | $1,450 | $144,167 | $0 | $0 |
| 2018 | $0 | $144,000 | $77,000 | $67,000 |
| 2017 | $1,435 | $144,000 | $0 | $0 |
| 2016 | -- | $144,000 | $0 | $0 |
| 2015 | $1,476 | $145,900 | $0 | $0 |
| 2014 | $1,476 | $145,900 | $0 | $0 |
Source: Public Records
Map
Nearby Homes
- 313 S Washington St
- 426 S Washington St
- 218 S Union Ave
- 203B Pointe Way
- 202 Seneca Way Unit 38
- 204 Seneca Way Unit 12
- 556 Congress Ave
- 317 S Stokes St
- 562 Girard St
- Sophia Plan at Bulle Rock - Villas
- Jordan II Plan at Bulle Rock - Villas
- Jordan III Plan at Bulle Rock - Villas
- Carson II Plan at Bulle Rock - Villas
- 605 Concord St Unit 3E
- 515 Green St
- 312 Lafayette St
- 610 Lewis St
- 314 N Stokes St
- 714 Revolution St
- 726 Girard St
- 301 Fountain St
- 313 Fountain St
- 317 Fountain St
- 214 Market St
- 214 Market St Unit 214
- 310 Market St
- 316 Fountain St
- 306 Bourbon St
- 310 Bourbon St
- 314 Bourbon St
- 217 S Washington St
- 300 Market St
- 300 Bourbon St
- 316 Bourbon St
- 214 Strawberry Ln
- 312 Fountain St
- 213 S Washington St
- 314 Fountain St
- 100 Bourbon St
- 350 Bourbon St