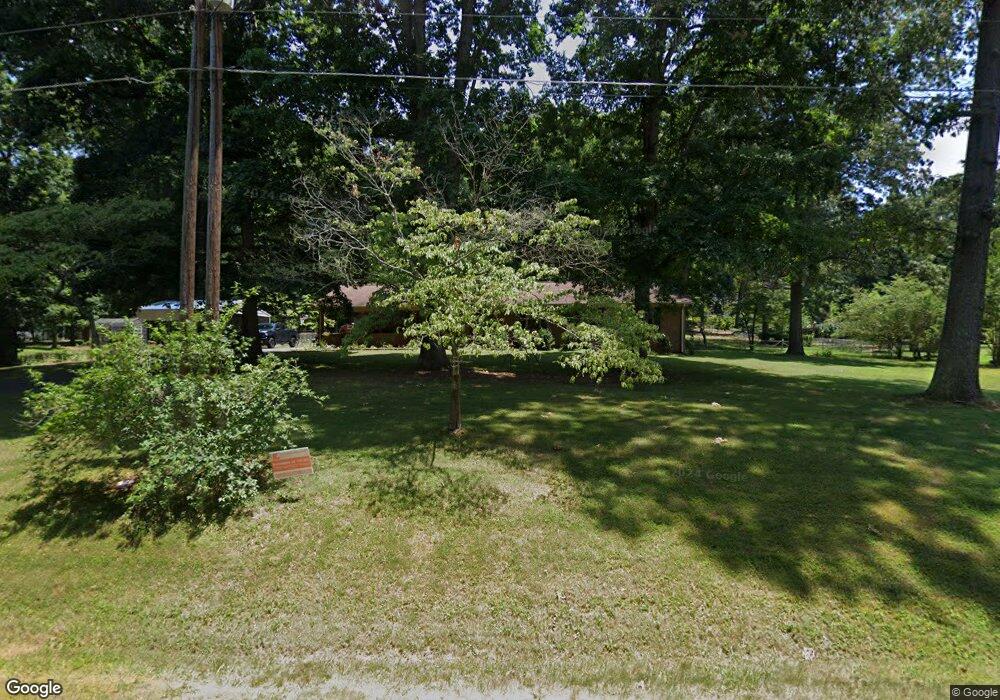
307 Gwen Rd Hillsborough, NC 27278
Estimated Value: $414,000 - $451,000
3
Beds
2
Baths
1,893
Sq Ft
$228/Sq Ft
Est. Value
About This Home
This home is located at 307 Gwen Rd, Hillsborough, NC 27278 and is currently estimated at $431,040, approximately $227 per square foot. 307 Gwen Rd is a home located in Orange County with nearby schools including River Park Elementary School, Orange Middle School, and Eno River Academy.
Ownership History
Date
Name
Owned For
Owner Type
Purchase Details
Closed on
Feb 2, 2021
Sold by
Terrel Mark A and Hoag Terrell Catherine
Bought by
Terrell Mark A and Hoag Terrell Catherine
Current Estimated Value
Home Financials for this Owner
Home Financials are based on the most recent Mortgage that was taken out on this home.
Original Mortgage
$291,169
Outstanding Balance
$259,364
Interest Rate
2.6%
Mortgage Type
VA
Estimated Equity
$171,676
Purchase Details
Closed on
Jun 3, 2017
Sold by
Baity Billy S and Baity Nancy H
Bought by
Terrell Mark A and Hoag Catherine L
Home Financials for this Owner
Home Financials are based on the most recent Mortgage that was taken out on this home.
Original Mortgage
$210,600
Interest Rate
3.97%
Mortgage Type
New Conventional
Purchase Details
Closed on
Jun 1, 1976
Bought by
Baity and Baity
Create a Home Valuation Report for This Property
The Home Valuation Report is an in-depth analysis detailing your home's value as well as a comparison with similar homes in the area
Home Values in the Area
Average Home Value in this Area
Purchase History
| Date | Buyer | Sale Price | Title Company |
|---|---|---|---|
| Terrell Mark A | -- | Americas Title Company | |
| Terrell Mark A | $234,000 | None Available | |
| Baity | $5,900 | -- |
Source: Public Records
Mortgage History
| Date | Status | Borrower | Loan Amount |
|---|---|---|---|
| Open | Terrell Mark A | $291,169 | |
| Closed | Terrell Mark A | $210,600 |
Source: Public Records
Tax History Compared to Growth
Tax History
| Year | Tax Paid | Tax Assessment Tax Assessment Total Assessment is a certain percentage of the fair market value that is determined by local assessors to be the total taxable value of land and additions on the property. | Land | Improvement |
|---|---|---|---|---|
| 2025 | $3,219 | $421,500 | $135,900 | $285,600 |
| 2024 | $2,473 | $238,500 | $57,000 | $181,500 |
| 2023 | $2,387 | $238,500 | $57,000 | $181,500 |
| 2022 | $2,346 | $238,000 | $56,500 | $181,500 |
| 2021 | $2,316 | $238,000 | $56,500 | $181,500 |
| 2020 | $2,326 | $226,900 | $56,500 | $170,400 |
| 2018 | $2,269 | $226,900 | $56,500 | $170,400 |
| 2017 | -- | $226,900 | $56,500 | $170,400 |
| 2016 | $2,300 | $228,054 | $65,036 | $163,018 |
| 2015 | $2,300 | $228,054 | $65,036 | $163,018 |
| 2014 | $2,257 | $228,054 | $65,036 | $163,018 |
Source: Public Records
Map
Nearby Homes
- 518 Buttonwood Dr
- 612 Miller Rd
- 920 Apple Ln
- 501 Orange High School Rd
- 522 N Scotswood Blvd
- 209 N Scotswood Blvd
- Lot 1 Magpie Ln
- Lot 6 Magpie Ln
- 1006 Bartlett Cir
- Lot 3 Magpie Ln
- Lot 17 Magpie Ln
- 2103 Bartlett Cir
- 1905 Bartlett Cir
- 1008 Panther Ct
- Lot 8 Magpie Ln
- 1212 Saint Marys Rd
- 615 N Churton St
- 620 Mcadams Rd
- 110 E Orange St
- 515 N Churton St Unit 203
- 321 Gwen Rd
- 302 N English Hill Ln
- 702 Nancy Dr
- 306 N English Hill Ln
- 312 Gwen Rd
- 325 Gwen Rd
- 306 N English Hill Ln
- 231 Gwen Rd
- 703 Nancy Dr
- 318 Gwen Rd
- 303 N English Hill Ln
- 313 N English Hill Ln
- 310 N English Hill Ln
- 305 N English Hill Ln
- 226 Gwen Rd
- 227 Gwen Rd
- 307 N English Hill Ln
- 320 Gwen Rd
- 210 S English Hill Ln
- 213 S English Hill Ln