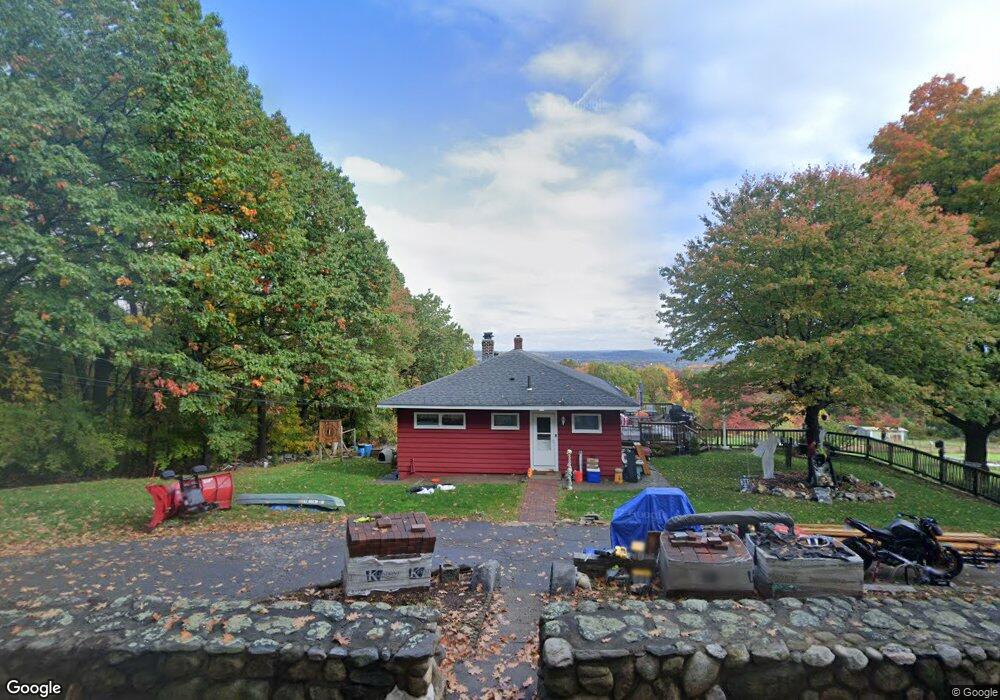
307 Hill St Leominster, MA 01453
Estimated Value: $444,000 - $517,000
3
Beds
1
Bath
1,160
Sq Ft
$418/Sq Ft
Est. Value
About This Home
This home is located at 307 Hill St, Leominster, MA 01453 and is currently estimated at $485,351, approximately $418 per square foot. 307 Hill St is a home located in Worcester County with nearby schools including Leominster High School, St. Leo School, and St. Anna Catholic School.
Ownership History
Date
Name
Owned For
Owner Type
Purchase Details
Closed on
Nov 11, 2020
Sold by
Rivard David and Rivard Therese
Bought by
Rivard David A and Rivard Sondra N
Current Estimated Value
Home Financials for this Owner
Home Financials are based on the most recent Mortgage that was taken out on this home.
Original Mortgage
$319,000
Outstanding Balance
$283,350
Interest Rate
2.7%
Mortgage Type
New Conventional
Estimated Equity
$202,001
Purchase Details
Closed on
Oct 7, 2004
Sold by
Rivard David and Rivard Theresa
Bought by
Tocci Joseph J and Tocci Virginia A
Create a Home Valuation Report for This Property
The Home Valuation Report is an in-depth analysis detailing your home's value as well as a comparison with similar homes in the area
Home Values in the Area
Average Home Value in this Area
Purchase History
| Date | Buyer | Sale Price | Title Company |
|---|---|---|---|
| Rivard David A | $355,000 | None Available | |
| Tocci Joseph J | $25,000 | -- |
Source: Public Records
Mortgage History
| Date | Status | Borrower | Loan Amount |
|---|---|---|---|
| Open | Rivard David A | $319,000 |
Source: Public Records
Tax History Compared to Growth
Tax History
| Year | Tax Paid | Tax Assessment Tax Assessment Total Assessment is a certain percentage of the fair market value that is determined by local assessors to be the total taxable value of land and additions on the property. | Land | Improvement |
|---|---|---|---|---|
| 2025 | $5,651 | $402,748 | $178,548 | $224,200 |
| 2024 | $5,688 | $392,000 | $185,800 | $206,200 |
| 2023 | $5,465 | $351,700 | $161,500 | $190,200 |
| 2022 | $5,228 | $315,700 | $141,500 | $174,200 |
| 2021 | $4,875 | $268,900 | $112,000 | $156,900 |
| 2020 | $4,668 | $259,600 | $112,000 | $147,600 |
| 2019 | $4,496 | $242,500 | $107,200 | $135,300 |
| 2018 | $4,423 | $228,800 | $104,400 | $124,400 |
| 2017 | $4,193 | $212,500 | $97,400 | $115,100 |
| 2016 | $4,053 | $207,000 | $97,400 | $109,600 |
| 2015 | $3,890 | $200,100 | $97,400 | $102,700 |
| 2014 | $3,744 | $198,200 | $102,700 | $95,500 |
Source: Public Records
Map
Nearby Homes