L
Seller's Agent in 2026
Lauren Keleher Meidinger
Pave Realty
(919) 723-7801
2 in this area
52 Total Sales
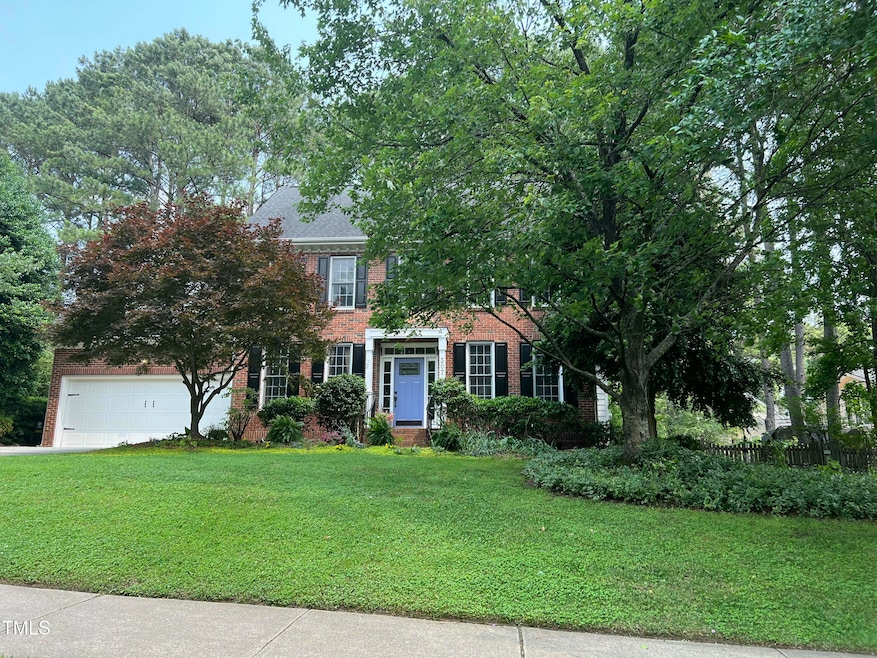

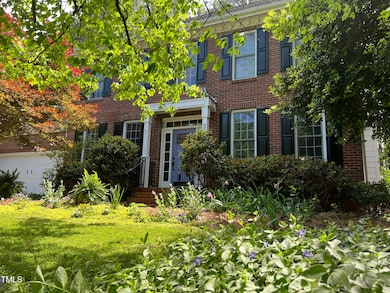
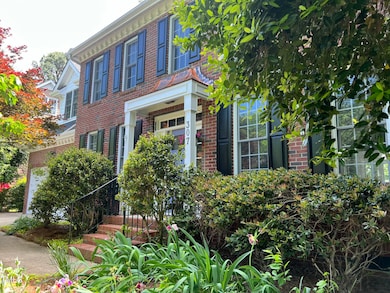

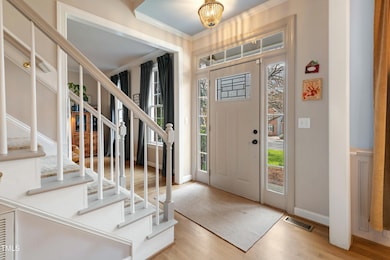
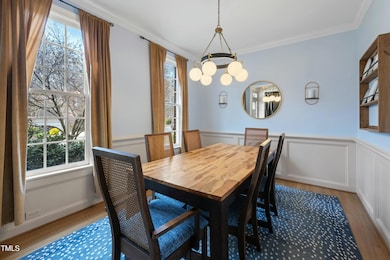
Charming Home in Coveted Abbington Nestled on a picturesque, tree-lined street in the highly sought-after Abbington subdivision, this beautifully maintained 4-bedroom, 2.5-bathroom home blends timeless charm with modern upgrades. Thoughtfully designed and full of natural light, it offers comfortable living now with room to grow—thanks to a spacious third-floor walk-up attic ready for your personal touch. Recent updates include a custom kitchen remodel with premium finishes, refinished hardwood floors, fresh interior paint, and a high-efficiency tankless water heater. The fully fenced, flat backyard is ideal for entertaining, gardening, or simply unwinding in your own private oasis. Enjoy the best of community living just steps away with Abbington's premier amenities, including a pool, playground, and tennis courts- perfect for staying active and connected. Don't miss this rare opportunity to own a move-in-ready home with unmatched value in one of the area's most desirable neighborhoods.
Last Agent to Sell the Property
Pave Realty License #299124 Listed on: 12/02/2025
| Date | Type | Sale Price | Title Company |
|---|---|---|---|
| Warranty Deed | $718,000 | None Listed On Document | |
| Warranty Deed | $375,000 | None Available | |
| Warranty Deed | $239,500 | -- |
| Date | Status | Loan Amount | Loan Type |
|---|---|---|---|
| Open | $574,400 | New Conventional | |
| Previous Owner | $387,375 | VA | |
| Previous Owner | $227,550 | No Value Available |
| Date | Event | Price | List to Sale | Price per Sq Ft |
|---|---|---|---|---|
| 02/12/2026 02/12/26 | Sold | $718,000 | -1.0% | $311 / Sq Ft |
| 01/04/2026 01/04/26 | Pending | -- | -- | -- |
| 12/02/2025 12/02/25 | For Sale | $725,000 | -- | $314 / Sq Ft |
| Year | Tax Paid | Tax Assessment Tax Assessment Total Assessment is a certain percentage of the fair market value that is determined by local assessors to be the total taxable value of land and additions on the property. | Land | Improvement |
|---|---|---|---|---|
| 2025 | $5,422 | $618,719 | $230,000 | $388,719 |
| 2024 | $5,301 | $618,719 | $230,000 | $388,719 |
| 2023 | $4,260 | $386,485 | $90,000 | $296,485 |
| 2022 | $3,999 | $386,485 | $90,000 | $296,485 |
| 2021 | $3,846 | $386,485 | $90,000 | $296,485 |
| 2020 | $3,808 | $386,485 | $90,000 | $296,485 |
| 2019 | $3,995 | $350,038 | $95,000 | $255,038 |
| 2018 | $3,763 | $350,038 | $95,000 | $255,038 |
| 2017 | $3,503 | $350,038 | $95,000 | $255,038 |
| 2016 | $3,452 | $350,038 | $95,000 | $255,038 |
| 2015 | $3,461 | $342,565 | $85,000 | $257,565 |
| 2014 | $3,336 | $342,565 | $85,000 | $257,565 |
L
Seller's Agent in 2026
Lauren Keleher Meidinger
Pave Realty
(919) 723-7801
2 in this area
52 Total Sales

Buyer's Agent in 2026
Cindi Honeycutt
Keller Williams Realty
(919) 676-0600
1 in this area
174 Total Sales
Buyer Co-Listing Agent in 2026
Zach Honeycutt
Keller Williams Realty
(919) 676-0600
2 in this area
57 Total Sales
Source: Doorify MLS
MLS Number: 10135453
APN: 0722.04-94-7539-000
Disclaimer: Certain information contained herein is derived from information provided by parties other than Homes.com. All information provided is deemed reliable, but is not guaranteed to be accurate and should be independently verified.
![]() Some IDX listings have been excluded from this IDX display. Brokers make an effort to deliver accurate information, but buyers should independently verify any information on which they will rely in a transaction. The listing broker shall not be responsible for any typographical errors, misinformation, or misprints, and they shall be held totally harmless from any damages arising from reliance upon this data. This data is provided exclusively for consumers’ personal, non-commercial use. Listings marked with an icon are provided courtesy of the Doorify MLS, Inc. of North Carolina, Internet Data Exchange Database. Closed (sold) listings may have been listed and/or sold by a real estate firm other than the firm(s) featured on this website. Closed data is not available until the sale of the property is recorded in the MLS. Home sale data is not an appraisal, CMA, competitive or comparative market analysis, or home valuation of any property. Copyright 2026 Doorify MLS, Inc. of North Carolina. All rights reserved.
Some IDX listings have been excluded from this IDX display. Brokers make an effort to deliver accurate information, but buyers should independently verify any information on which they will rely in a transaction. The listing broker shall not be responsible for any typographical errors, misinformation, or misprints, and they shall be held totally harmless from any damages arising from reliance upon this data. This data is provided exclusively for consumers’ personal, non-commercial use. Listings marked with an icon are provided courtesy of the Doorify MLS, Inc. of North Carolina, Internet Data Exchange Database. Closed (sold) listings may have been listed and/or sold by a real estate firm other than the firm(s) featured on this website. Closed data is not available until the sale of the property is recorded in the MLS. Home sale data is not an appraisal, CMA, competitive or comparative market analysis, or home valuation of any property. Copyright 2026 Doorify MLS, Inc. of North Carolina. All rights reserved.
Ask me questions while you tour the home.