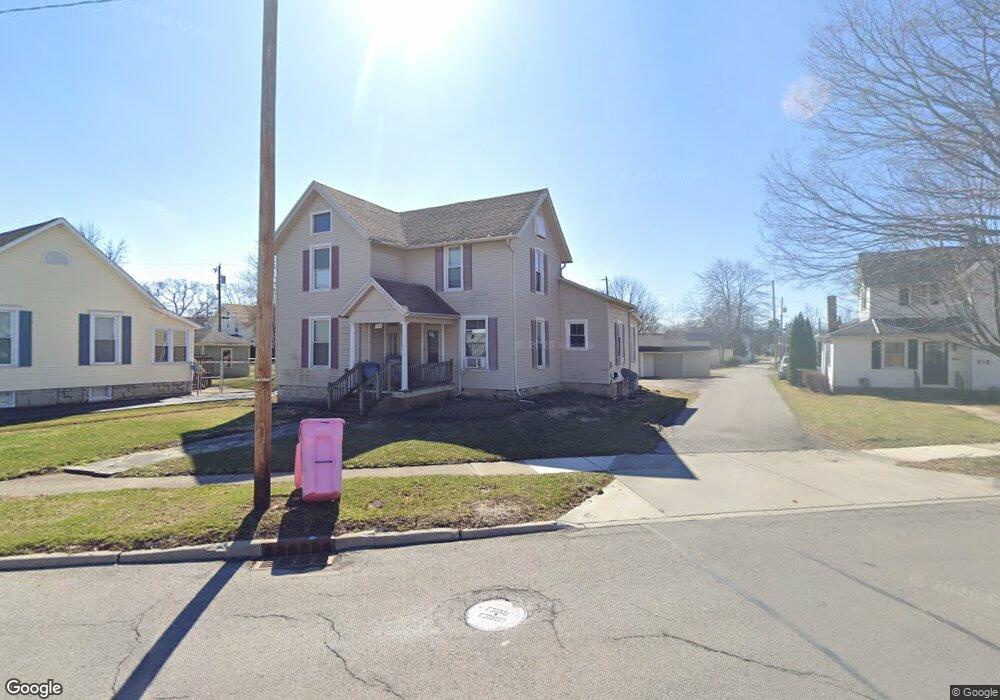
307 Lima Ave Findlay, OH 45840
Estimated Value: $170,697 - $200,000
4
Beds
2
Baths
2,041
Sq Ft
$88/Sq Ft
Est. Value
About This Home
This home is located at 307 Lima Ave, Findlay, OH 45840 and is currently estimated at $179,924, approximately $88 per square foot. 307 Lima Ave is a home located in Hancock County with nearby schools including Lincoln Elementary School, Donnell Middle School, and Findlay High School.
Ownership History
Date
Name
Owned For
Owner Type
Purchase Details
Closed on
Jun 9, 2017
Sold by
Findlay Rentals Llc
Bought by
Timber Ridge Properties Llc
Current Estimated Value
Home Financials for this Owner
Home Financials are based on the most recent Mortgage that was taken out on this home.
Original Mortgage
$100,000
Outstanding Balance
$83,179
Interest Rate
4.02%
Mortgage Type
Future Advance Clause Open End Mortgage
Estimated Equity
$96,745
Purchase Details
Closed on
Jul 1, 2005
Sold by
Deidrick Arden D and Deidrick Bonnie L
Bought by
Conine William A and Conine Kathy L
Home Financials for this Owner
Home Financials are based on the most recent Mortgage that was taken out on this home.
Original Mortgage
$78,000
Interest Rate
5.37%
Mortgage Type
Fannie Mae Freddie Mac
Purchase Details
Closed on
May 26, 1992
Bought by
Deidrick Arden D and Deidrick Bonnie
Create a Home Valuation Report for This Property
The Home Valuation Report is an in-depth analysis detailing your home's value as well as a comparison with similar homes in the area
Home Values in the Area
Average Home Value in this Area
Purchase History
| Date | Buyer | Sale Price | Title Company |
|---|---|---|---|
| Timber Ridge Properties Llc | $125,000 | Flag City Title | |
| Conine William A | $104,000 | Mid Am Title Agency | |
| Deidrick Arden D | -- | -- |
Source: Public Records
Mortgage History
| Date | Status | Borrower | Loan Amount |
|---|---|---|---|
| Open | Timber Ridge Properties Llc | $100,000 | |
| Previous Owner | Conine William A | $78,000 |
Source: Public Records
Tax History
| Year | Tax Paid | Tax Assessment Tax Assessment Total Assessment is a certain percentage of the fair market value that is determined by local assessors to be the total taxable value of land and additions on the property. | Land | Improvement |
|---|---|---|---|---|
| 2024 | $1,594 | $43,720 | $7,210 | $36,510 |
| 2023 | $1,596 | $43,720 | $7,210 | $36,510 |
| 2022 | $1,591 | $43,720 | $7,210 | $36,510 |
| 2021 | $1,484 | $35,520 | $7,390 | $28,130 |
| 2020 | $1,483 | $35,520 | $7,390 | $28,130 |
| 2019 | $1,454 | $35,520 | $7,390 | $28,130 |
| 2018 | $1,348 | $30,210 | $5,200 | $25,010 |
| 2017 | $674 | $30,210 | $5,200 | $25,010 |
| 2016 | $1,338 | $30,210 | $5,200 | $25,010 |
| 2015 | $1,029 | $22,870 | $5,200 | $17,670 |
| 2014 | $1,029 | $22,870 | $5,200 | $17,670 |
| 2012 | $1,082 | $23,870 | $5,200 | $18,670 |
Source: Public Records
Map
Nearby Homes
- 412 Lima Ave
- 416 1/2 Lima Ave
- 815 Liberty St
- 845 Hurd Ave
- 423 Elm St
- 860 Hurd Ave
- 1113 Hurd Ave
- 865 S Main St
- 216 1st St
- 829 Maple Ave
- 514 Liberty St
- 527 W Sandusky St
- 324 W Mcpherson Ave
- 1304 Douglas Pkwy
- 123 Glendale Ave
- 206 Greenlawn Ave
- 807 W Main Cross St
- 407 Washington St
- 315 Fairlawn Place
- 623 E Sandusky St
Your Personal Tour Guide
Ask me questions while you tour the home.