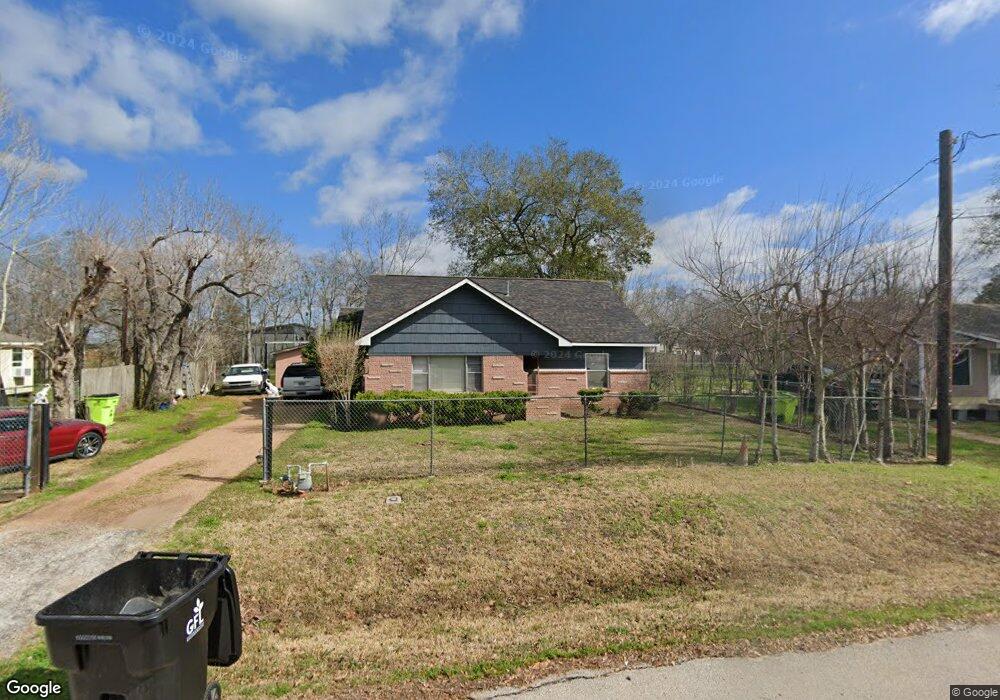
307 Mebane Ln Rosenberg, TX 77471
Estimated Value: $129,294 - $240,000
2
Beds
1
Bath
918
Sq Ft
$182/Sq Ft
Est. Value
About This Home
This home is located at 307 Mebane Ln, Rosenberg, TX 77471 and is currently estimated at $166,824, approximately $181 per square foot. 307 Mebane Ln is a home located in Fort Bend County with nearby schools including Bowie Elementary School, Navarro Middle School, and George Junior High School.
Ownership History
Date
Name
Owned For
Owner Type
Purchase Details
Closed on
Feb 20, 2025
Sold by
Ibarra Luis Loredo and Loredo Luis
Bought by
Ives Scott Jeffrey and Padron Adilene Baena
Current Estimated Value
Home Financials for this Owner
Home Financials are based on the most recent Mortgage that was taken out on this home.
Original Mortgage
$70,000
Outstanding Balance
$63,023
Interest Rate
6.93%
Mortgage Type
Seller Take Back
Estimated Equity
$103,801
Purchase Details
Closed on
Aug 4, 2017
Sold by
Loredo Luis
Bought by
Baena Efrain and Padron Elvia
Purchase Details
Closed on
Feb 28, 2017
Sold by
Socha Sue Ann
Bought by
Baena Efrain and Elvia Padron
Purchase Details
Closed on
Oct 12, 2016
Sold by
Krell Dorothy Estate
Bought by
Baena Efrain and Elvia Padron
Purchase Details
Closed on
Dec 30, 2015
Sold by
Krell Dorothy
Bought by
Baena Efrain and Elvia Padron
Create a Home Valuation Report for This Property
The Home Valuation Report is an in-depth analysis detailing your home's value as well as a comparison with similar homes in the area
Home Values in the Area
Average Home Value in this Area
Purchase History
| Date | Buyer | Sale Price | Title Company |
|---|---|---|---|
| Ives Scott Jeffrey | -- | None Listed On Document | |
| Baena Efrain | -- | Coastal Title Co | |
| Baena Efrain | -- | -- | |
| Baena Efrain | -- | -- | |
| Baena Efrain | -- | -- |
Source: Public Records
Mortgage History
| Date | Status | Borrower | Loan Amount |
|---|---|---|---|
| Open | Ives Scott Jeffrey | $70,000 |
Source: Public Records
Tax History Compared to Growth
Tax History
| Year | Tax Paid | Tax Assessment Tax Assessment Total Assessment is a certain percentage of the fair market value that is determined by local assessors to be the total taxable value of land and additions on the property. | Land | Improvement |
|---|---|---|---|---|
| 2025 | $1,664 | $72,072 | $22,995 | $49,077 |
| 2024 | $1,664 | $88,073 | $22,995 | $65,078 |
| 2023 | $1,664 | $88,567 | $22,995 | $65,572 |
| 2022 | $1,689 | $82,440 | $23,000 | $59,440 |
| 2021 | $1,314 | $63,350 | $23,000 | $40,350 |
| 2020 | $1,347 | $63,480 | $23,000 | $40,480 |
| 2019 | $1,448 | $63,390 | $23,000 | $40,390 |
| 2018 | $1,421 | $61,220 | $23,000 | $38,220 |
| 2017 | $1,396 | $59,820 | $23,000 | $36,820 |
| 2016 | $1,904 | $81,590 | $44,730 | $36,860 |
| 2015 | $1,933 | $82,410 | $44,730 | $37,680 |
| 2014 | $1,953 | $82,250 | $44,730 | $37,520 |
Source: Public Records
Map
Nearby Homes
- 802 Matamoros Dr
- 206 Timothy Trail
- 217 Timothy Trail
- 1015 Santa fe Ct
- 2511 Spur 529
- 805 Avenue J
- 3326 Tilley Dr
- 903 Brooks Ave
- 1112 James St
- 1108 Easy St
- 000 Bamore Rd
- 1208 Klare Ave
- 1301 Southgate Dr
- 1126 Brooks Ave
- 00 Brooks Ave
- 1400 Dyer Ave
- 804 Grunwald Heights Blvd
- 1613 Mulcahy St
- 1220 Mulcahy St
- 0 Muegge Rd Unit 43223201