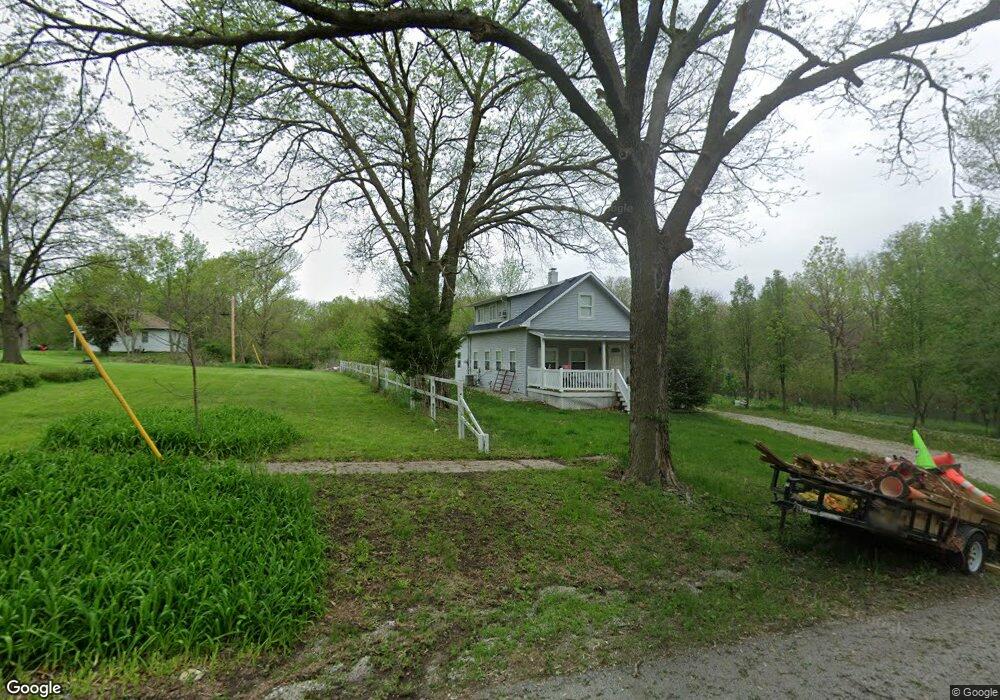
307 N 2nd St Dunbar, NE 68346
Estimated Value: $176,000 - $199,212
3
Beds
3
Baths
1,347
Sq Ft
$136/Sq Ft
Est. Value
About This Home
This home is located at 307 N 2nd St, Dunbar, NE 68346 and is currently estimated at $182,553, approximately $135 per square foot. 307 N 2nd St is a home located in Otoe County with nearby schools including Elementary School at Syracuse and High School at Syracuse.
Ownership History
Date
Name
Owned For
Owner Type
Purchase Details
Closed on
May 12, 2025
Sold by
Williams Nicholas C and Williams Rachel M
Bought by
Gist Holli
Current Estimated Value
Home Financials for this Owner
Home Financials are based on the most recent Mortgage that was taken out on this home.
Original Mortgage
$179,292
Outstanding Balance
$178,677
Interest Rate
6.81%
Mortgage Type
FHA
Estimated Equity
$3,876
Purchase Details
Closed on
Apr 29, 2021
Sold by
Morfin Mario and Morfin Karina
Bought by
Williams Nicholas C and Williams Rachel M
Home Financials for this Owner
Home Financials are based on the most recent Mortgage that was taken out on this home.
Original Mortgage
$142,000
Interest Rate
3%
Mortgage Type
New Conventional
Purchase Details
Closed on
Jun 30, 2016
Sold by
Morfin Mario and Herrera Mora Ramon
Bought by
Morfin Mario and Morfin Karina
Purchase Details
Closed on
Apr 15, 2016
Sold by
Essary Janeen
Bought by
Morfin Mario and Herrera Mora Ramon
Create a Home Valuation Report for This Property
The Home Valuation Report is an in-depth analysis detailing your home's value as well as a comparison with similar homes in the area
Home Values in the Area
Average Home Value in this Area
Purchase History
| Date | Buyer | Sale Price | Title Company |
|---|---|---|---|
| Gist Holli | $178,000 | Charter Title | |
| Williams Nicholas C | $142,000 | Charter T&E Svcs | |
| Morfin Mario | $9,000 | None Available | |
| Morfin Mario | $9,000 | None Available |
Source: Public Records
Mortgage History
| Date | Status | Borrower | Loan Amount |
|---|---|---|---|
| Open | Gist Holli | $179,292 | |
| Previous Owner | Williams Nicholas C | $142,000 |
Source: Public Records
Tax History Compared to Growth
Tax History
| Year | Tax Paid | Tax Assessment Tax Assessment Total Assessment is a certain percentage of the fair market value that is determined by local assessors to be the total taxable value of land and additions on the property. | Land | Improvement |
|---|---|---|---|---|
| 2024 | $1,489 | $102,666 | $2,670 | $99,996 |
| 2023 | $1,748 | $102,666 | $2,670 | $99,996 |
| 2022 | $1,454 | $86,000 | $2,670 | $83,330 |
| 2021 | $1,418 | $86,000 | $2,670 | $83,330 |
| 2020 | $1,350 | $78,420 | $2,670 | $75,750 |
| 2019 | $890 | $50,890 | $2,670 | $48,220 |
| 2018 | $664 | $40,090 | $2,780 | $37,310 |
| 2017 | $154 | $9,320 | $2,330 | $6,990 |
| 2016 | $191 | $11,540 | $2,330 | $9,210 |
| 2015 | $192 | $11,540 | $2,330 | $9,210 |
| 2014 | $227 | $12,610 | $2,330 | $10,280 |
| 2012 | $232 | $12,610 | $2,330 | $10,280 |
Source: Public Records
Map
Nearby Homes