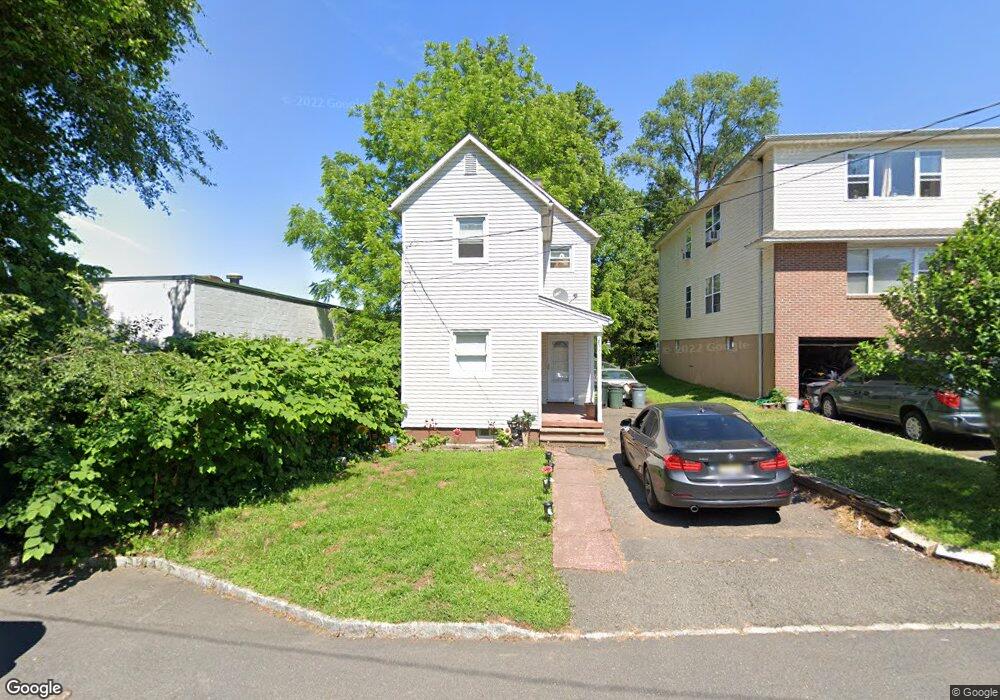
307 N 8th St Kenilworth, NJ 07033
Estimated Value: $346,633 - $476,000
--
Bed
--
Bath
--
Sq Ft
2,483
Sq Ft Lot
About This Home
This home is located at 307 N 8th St, Kenilworth, NJ 07033 and is currently estimated at $428,658. 307 N 8th St is a home located in Union County with nearby schools including Harding Elementary School, David Brearley High School, and St. Theresa School.
Ownership History
Date
Name
Owned For
Owner Type
Purchase Details
Closed on
Jun 9, 2003
Sold by
Luciani Brian
Bought by
Perez Antonio and Aparicio Maria
Current Estimated Value
Home Financials for this Owner
Home Financials are based on the most recent Mortgage that was taken out on this home.
Original Mortgage
$168,000
Outstanding Balance
$73,539
Interest Rate
5.77%
Estimated Equity
$355,119
Purchase Details
Closed on
Jul 28, 1998
Sold by
Berrios Raymond A
Bought by
Ruiz Sharon L
Home Financials for this Owner
Home Financials are based on the most recent Mortgage that was taken out on this home.
Original Mortgage
$126,250
Interest Rate
6.92%
Mortgage Type
FHA
Purchase Details
Closed on
Mar 31, 1995
Sold by
Papparatto Frank
Bought by
V & R Realty Inc
Purchase Details
Closed on
Jan 6, 1995
Sold by
Borough Of Kenilworth
Bought by
Papparatto Frank
Create a Home Valuation Report for This Property
The Home Valuation Report is an in-depth analysis detailing your home's value as well as a comparison with similar homes in the area
Home Values in the Area
Average Home Value in this Area
Purchase History
| Date | Buyer | Sale Price | Title Company |
|---|---|---|---|
| Perez Antonio | $210,000 | -- | |
| Ruiz Sharon L | $127,500 | -- | |
| V & R Realty Inc | -- | -- | |
| Papparatto Frank | $65,000 | -- |
Source: Public Records
Mortgage History
| Date | Status | Borrower | Loan Amount |
|---|---|---|---|
| Open | Perez Antonio | $168,000 | |
| Previous Owner | Ruiz Sharon L | $126,250 |
Source: Public Records
Tax History Compared to Growth
Tax History
| Year | Tax Paid | Tax Assessment Tax Assessment Total Assessment is a certain percentage of the fair market value that is determined by local assessors to be the total taxable value of land and additions on the property. | Land | Improvement |
|---|---|---|---|---|
| 2025 | $7,340 | $115,000 | $50,000 | $65,000 |
| 2024 | $6,607 | $115,000 | $50,000 | $65,000 |
| 2023 | $6,607 | $115,000 | $50,000 | $65,000 |
| 2022 | $6,150 | $115,000 | $50,000 | $65,000 |
| 2021 | $5,993 | $115,000 | $50,000 | $65,000 |
| 2020 | $5,893 | $115,000 | $50,000 | $65,000 |
| 2019 | $5,808 | $115,000 | $50,000 | $65,000 |
| 2018 | $5,645 | $115,000 | $50,000 | $65,000 |
| 2017 | $5,605 | $115,000 | $50,000 | $65,000 |
| 2016 | $5,514 | $115,000 | $50,000 | $65,000 |
| 2015 | $5,368 | $115,000 | $50,000 | $65,000 |
| 2014 | $5,732 | $128,100 | $56,200 | $71,900 |
Source: Public Records
Map
Nearby Homes
- 210 N 10th St
- 126 N 13th St
- 52 N 7th St
- 30 N 8th St
- 224 N 17th St
- 252 Boulevard
- 341 N 19th St
- 327 Roosevelt Ln
- 33 Park Dr
- 136 N 21st St
- 18 Boyd Terrace
- 19 S 19th St
- 72 Windsor Place
- 46 N 22nd St
- 224 N 24th St
- 18 S 20th St
- 144 N Michigan Ave
- 151 Country Club Dr
- 161 Country Club Dr Unit 5
- 551 Clubhouse Ct Unit 1