
Seller's Agent in 2013
Christy Thomson
RE/MAX
(260) 316-9940
197 Total Sales

Estimated Value: $165,910 - $219,000
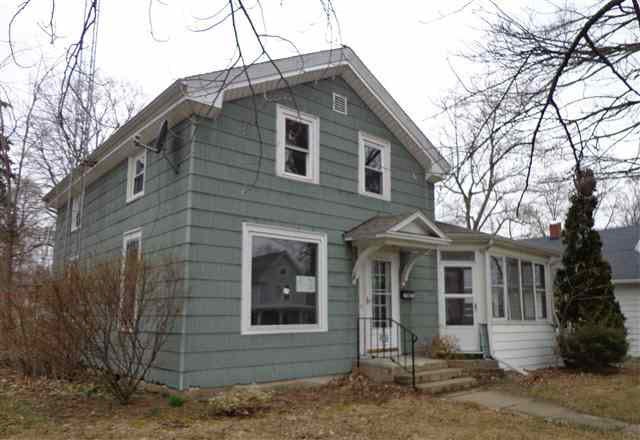
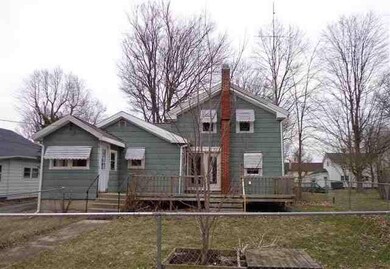
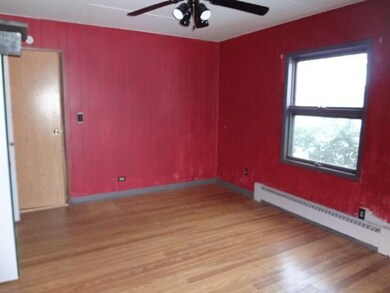
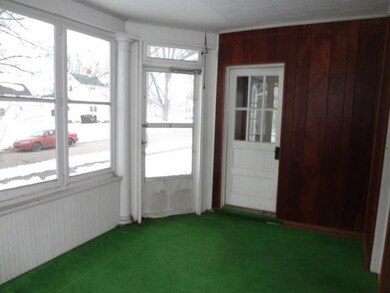
What a charmer! Come see this 4 bedroom home on a large lot ready for those summer grilling parties! Fenced yard can help make you feel safe if you have kids or animals. All this with a 2 car garage at this price and all you can say is WOW! This home is ready for you to own! Call today for your personal showing!
Last Buyer's Agent
NEIAR NonMember
NonMember NEIAR
| Date | Buyer | Sale Price | Title Company |
|---|---|---|---|
| Anu Sahni | $35,200 | Ppr Title Agency | |
| Secretary Of Housing & Urban D | $35,200 | Feiwell & Hannoy | |
| -- | $35,200 | Feiwell & Hannoy |
| Date | Event | Price | List to Sale | Price per Sq Ft |
|---|---|---|---|---|
| 04/18/2013 04/18/13 | Sold | $36,150 | +3.3% | $35 / Sq Ft |
| 03/27/2013 03/27/13 | Pending | -- | -- | -- |
| 03/15/2013 03/15/13 | For Sale | $35,000 | -- | $34 / Sq Ft |
| Year | Tax Paid | Tax Assessment Tax Assessment Total Assessment is a certain percentage of the fair market value that is determined by local assessors to be the total taxable value of land and additions on the property. | Land | Improvement |
|---|---|---|---|---|
| 2024 | $2,396 | $119,800 | $15,100 | $104,700 |
| 2023 | $2,276 | $113,800 | $13,900 | $99,900 |
| 2022 | $2,102 | $105,100 | $12,100 | $93,000 |
| 2021 | $1,728 | $86,400 | $11,800 | $74,600 |
| 2020 | $1,650 | $82,500 | $11,300 | $71,200 |
| 2019 | $1,572 | $78,600 | $10,700 | $67,900 |
| 2018 | $1,560 | $78,000 | $10,700 | $67,300 |
| 2017 | $1,488 | $74,400 | $10,700 | $63,700 |
| 2016 | $1,456 | $72,800 | $10,700 | $62,100 |
| 2014 | $1,408 | $70,400 | $10,700 | $59,700 |
| 2013 | $1,408 | $71,000 | $10,700 | $60,300 |
Seller's Agent in 2013
Christy Thomson
RE/MAX
(260) 316-9940
197 Total Sales
N
Buyer's Agent in 2013
NEIAR NonMember
NonMember NEIAR
Source: Indiana Regional MLS
MLS Number: 518129
APN: 44-07-19-300-001.085-002
Disclaimer: Certain information contained herein is derived from information provided by parties other than Homes.com. All information provided is deemed reliable, but is not guaranteed to be accurate and should be independently verified.
![]() Based on information submitted to the MLS GRID. All data is obtained from various sources and may not have been verified by broker or MLS GRID. Supplied Open House Information is subject to change without notice. All information should be independently reviewed and verified for accuracy. Properties may or may not be listed by the office/agent presenting the information. Some IDX listings have been excluded from this website. IDX information is provided exclusively for personal, non-commercial use, and may not be used for any purpose other than to identify prospective properties consumers may be interested in purchasing. Information is deemed reliable but not guaranteed.
Based on information submitted to the MLS GRID. All data is obtained from various sources and may not have been verified by broker or MLS GRID. Supplied Open House Information is subject to change without notice. All information should be independently reviewed and verified for accuracy. Properties may or may not be listed by the office/agent presenting the information. Some IDX listings have been excluded from this website. IDX information is provided exclusively for personal, non-commercial use, and may not be used for any purpose other than to identify prospective properties consumers may be interested in purchasing. Information is deemed reliable but not guaranteed.
Based on information submitted to the MLS GRID
Ask me questions while you tour the home.