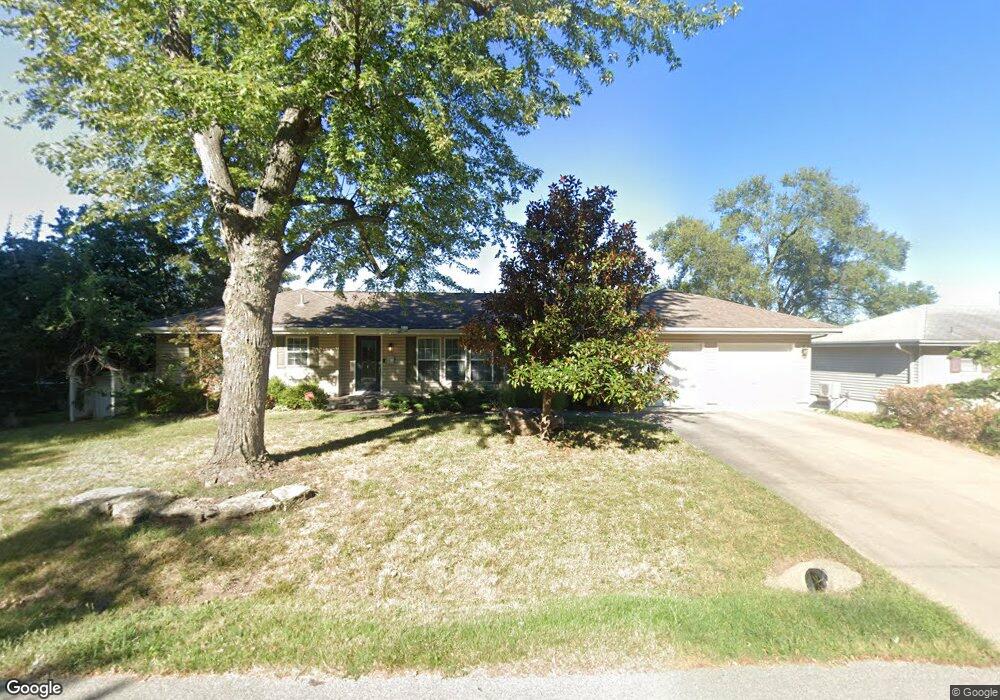
307 NW 17th St Blue Springs, MO 64015
Estimated Value: $246,000 - $284,000
3
Beds
2
Baths
1,264
Sq Ft
$206/Sq Ft
Est. Value
About This Home
This home is located at 307 NW 17th St, Blue Springs, MO 64015 and is currently estimated at $259,839, approximately $205 per square foot. 307 NW 17th St is a home located in Jackson County with nearby schools including Thomas J. Ultican Elementary School, Paul Kinder Middle School, and Blue Springs High School.
Ownership History
Date
Name
Owned For
Owner Type
Purchase Details
Closed on
Feb 18, 2020
Sold by
Patterson Dennis E and Patterson Teresa M
Bought by
Patterson Dennis E and Patterson Teresa M
Current Estimated Value
Purchase Details
Closed on
Jul 30, 2004
Sold by
Evans Cass and Evans Leslie K
Bought by
Patterson Dennis E and Patterson Teresa M
Home Financials for this Owner
Home Financials are based on the most recent Mortgage that was taken out on this home.
Original Mortgage
$128,000
Outstanding Balance
$64,281
Interest Rate
6.3%
Mortgage Type
Purchase Money Mortgage
Estimated Equity
$195,558
Purchase Details
Closed on
Mar 6, 1996
Sold by
Frechin James E and Frechin Melinda D
Bought by
Frechin James E and Frechin Melinda D
Home Financials for this Owner
Home Financials are based on the most recent Mortgage that was taken out on this home.
Original Mortgage
$57,800
Interest Rate
6.49%
Mortgage Type
Purchase Money Mortgage
Create a Home Valuation Report for This Property
The Home Valuation Report is an in-depth analysis detailing your home's value as well as a comparison with similar homes in the area
Home Values in the Area
Average Home Value in this Area
Purchase History
| Date | Buyer | Sale Price | Title Company |
|---|---|---|---|
| Patterson Dennis E | -- | None Available | |
| Patterson Dennis E | -- | Old Republic Title Of Kansas | |
| Frechin James E | -- | -- |
Source: Public Records
Mortgage History
| Date | Status | Borrower | Loan Amount |
|---|---|---|---|
| Open | Patterson Dennis E | $128,000 | |
| Previous Owner | Frechin James E | $57,800 |
Source: Public Records
Tax History Compared to Growth
Tax History
| Year | Tax Paid | Tax Assessment Tax Assessment Total Assessment is a certain percentage of the fair market value that is determined by local assessors to be the total taxable value of land and additions on the property. | Land | Improvement |
|---|---|---|---|---|
| 2025 | $2,791 | $36,685 | $11,130 | $25,555 |
| 2024 | $2,737 | $34,210 | $6,513 | $27,697 |
| 2023 | $2,737 | $34,209 | $3,095 | $31,114 |
| 2022 | $2,512 | $27,740 | $6,023 | $21,717 |
| 2021 | $2,509 | $27,740 | $6,023 | $21,717 |
| 2020 | $2,352 | $26,450 | $6,023 | $20,427 |
| 2019 | $2,274 | $26,450 | $6,023 | $20,427 |
| 2018 | $2,240 | $25,082 | $4,891 | $20,191 |
| 2017 | $2,240 | $25,082 | $4,891 | $20,191 |
| 2016 | $2,178 | $24,453 | $4,370 | $20,083 |
| 2014 | $1,950 | $21,820 | $4,404 | $17,416 |
Source: Public Records
Map
Nearby Homes
- 305 NW 17th St
- 503 NW 15th St
- 1109 NW B St
- 1705 SW Walnut St
- 2000 SW Smith St
- 401 SW 18th St
- 2317 NW Kensington Ct
- 2508 NW Castle Dr
- 505 SW 18th St
- 804 NW North Summit Cir
- 1700 SW Mc Arthur St
- 1109 NW Mock Ave
- 216 SW 26th St
- 913 NW Camelot Ct
- 510 SW 12 St
- 318 SW 10th St
- 804 NW Maynard St
- 516 NW Mill Ct
- 514 SW 10th St
- 2916 NW Chelsea Place
- 309 NW 17th St
- 306 NW 17th St
- 310 NW 17th St
- 304 NW 17th St
- 303 NW 17th St
- 400 NW 17th St
- 302 NW 17th St Unit A
- 405 NW 17th St
- 1703 NW Vesper St
- 1701 NW Vesper St
- 1607 NW Vesper St
- 1514 NW B St
- 1704 NW Vesper St
- 1512 NW B St
- 309 NW 16th St Unit A
- 1710 NW B St
- 207 NW 17th St
- 311 NW 16th St
- 1510 NW B St
- 307 NW 16th St